© The Korean Society of Agricultural Engineers. All rights reserved
ABSTRACT
Ⅰ. 서 론
암모니아는 강한 악취성을 띄고 대기 중 황산화물, 질소산화물과 반응하여 황산암모늄, 질산암모늄 등을 생성하는 무색의 가스상물질이다 (Sharma et al., 2007; Schiferl et al., 2014; Holt et al., 2015). 2016년 국가 대기오염물질 배출량 보고서에 따르면 농업부문에서 배출되는 암모니아는 전체 배출량의 78.7%이며 이 중 축산 분뇨관리가 91.8%의 높은값을 차지하는 것으로 보고되었다 (NIER, 2016). 이에 더욱 정확한 배출량 산정을 위해 축산부문 암모니아 인벤토리 개선 연구가 축종별로 수행 중이며, 특히 돼지에서 발생하는 배출량 산정 연구의 일환으로 강제환기식 돈사에서의 환기량 및 환기율을 산정하는 다양한 방법론이 적용되고 있다 (Breum et al., 1990; Seo et al., 2008; Ecim-Djuric and Topisirovic, 2010; Anthony et al., 2014; Kim et al., 2017; Oh et al., 2019).
강제환기식 돈사에서 발생하는 오염물질의 배출량을 측정하려면 개별물질 농도 이외에 배기팬의 정확한 환기량 정보 수집이 필요하다. 환기량을 측정하는 방법은 다양하며 기본적으로 제조사에서 제공하는 압력-환기량 공식을 이용하여 간단히 계산할 수 있다 (Heber et al., 2000). 하지만 제조사에서 제공하는 정보는 극히 제한적이고 시간이 지날수록 팬에 먼지가 쌓이거나 팬이 노후화되어 초기 설치된 팬의 성능과 달리 환기량에 변동이 생긴다 (Simmons and Lott, 1997; Casey et al., 2008). 이를 극복하기 위해 소형 환기량 측정 장치를 제작하여 팬에 부착 후, 환기율에 따른 압력을 환기량으로 환산하여 기록하는 방법은 전술한 문제점을 극복하고 정밀도 측면에서 훨씬 높은 결과를 얻을 수 있다는 장점이 있다. 하지만 장치 자체의 부피가 크고 상시 가동 시 돼지 사육환경 (행동 변화, 호흡기 질병 등)에 영향을 줄 수 있으므로 돈사 운영에 있어 실시간 모니터링이 매우 어렵다는 단점 역시 존재한다.
위의 이유로 연구자들은 소형 환기량 측정 장치를 이용해 가동요소 (압력, 전압 등)에 따른 환기량을 최초 실측한 뒤 상관 그래프를 작성하고, 사육 기간 중 팬에 연결된 전기 신호만을 모니터링하여 환기량을 간접 추정하는 기법을 적용하고 있다 (Aarnink et al., 1995, 1996; Ni et al., 2000; Zhu et al., 2000; Lim et al., 2004). 이러한 방식으로 환기량을 추정할 때 결측구간의 범위 및 적용되는 통계기법에 따라 환기량에 차이가 발생하며, 적절치 않을 경우 추정된 환기량에 대한 불확도가 증가할 가능성을 충분히 고려해야 한다. 전기신호에 대한 환기량은 팬에 따라 선형 관계 또는 비선형 관계일 수 있으며 (VERA, 2011; Fuller et al., 2013; Moophayak et al., 2013; Tang et al., 2015), 특히 비선형 관계에서 결측구간에 대한 추정은 구간별 곡률에 따라 실측량 대비 오차가 크게 발생할 수 있다. 이에 본 연구는 강제환기식 돈사의 환기량 간접추정에 있어 다양한 통계기법을 비교하여 오차를 최소화할 수 있는 과정을 제안하였다.
Ⅱ. 재료 및 방법
1. 환기량 측정 시스템
환기량 측정은 입기된 공기가 중앙-천장형 팬 (Vostermans ventilation BV, Multifan 4E50 (∅630), Netherlands)에 의해 환기되는 강제환기식 구조의 밀폐형 육성사에서 실시하였다 (Fig. 1). 동일한 환기팬 및 구조의 돈방 4개소 (A~D)와 빈 돈방 1개소 (E), 총 5개소 돈방 (각 돈방 면적: 11.95 m × 8.32 m) 내 환기팬에 정류장치 (honeycomb mesh)가 포함된 소형 환기량 측정 장치를 부착하였다. 우선, 환기량 측정 규정 (ASHRAE Fundamentals, AMCA Publication 203, 40CFR60)에 맞게 제작된 다수의 구멍을 통해서 배기팬 가동에 따른 전압 ( , Pa)과 정압 (
 , Pa)의 차이를 차압 측정기 (TSI, DP-Calc 5825, US)로 측정하여 동압 (
 , Pa)을 계산한다 (ASHRAE, 1993). 이후, 측정된 동압과 공기 밀도 (
 : 1.2 kg/m3), 측정부의 면적 (
 , m2)을 이용하여 아래 식 (1), (2)를 통해 시간별 환기량 (
 , m3/h)으로 환산하였다.
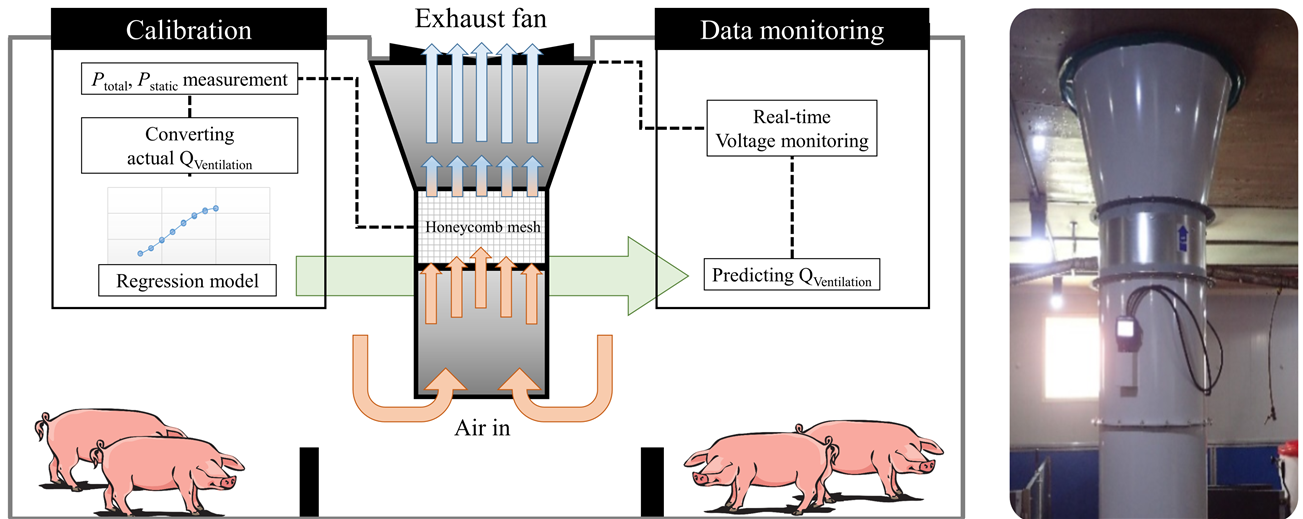
Fig. 1
Ventilation measurement instrument and real-time data monitoring process
실험 기간 중 농장의 최소 환기량은 전압효율 (정격전압 대비 입력전압) 30%로 설정되어 운영하였으며 E 돈방의 경우 돼지 출하 후 빈 기간을 이용하여 배기팬의 환기량을 전압효율 30%에서부터 100%까지 10% 간격으로 각각 5회 반복 측정 (1회당 5초 평균)하였다. A~D 돈방에는 출생 후 약 10주가 지난 돼지가 입식되어 육성 중이었고 돼지 사육 중 임의로 환기량을 변경하여 장기간 실험을 수행할 경우 호흡기 질병 영향을 미칠 수 있다는 점을 고려하여 전압효율 30%, 50%, 70%, 100%에서 환기량을 실측하였으며 E 돈방과 동일하게 구간별 5번 측정하였다. 전압효율은 돈사 내부 관제 시스템을 통해 1%/min 해상도로 모니터링되어 최종 환기량 추정에 사용되었다.
2. 회귀 모델
회귀 모델은 크게 선형과 비선형 모델로 구분할 수 있다. 실측된 데이터로부터 뚜렷한 시각적 선형 관계가 판단될 경우 선형회귀를 적용해 추정값을 얻어낼 수 있지만, 그렇지 않으면 다양한 비선형 회귀 모델의 비교가 선행되어야 한다. 환기량은 수집된 전압효율에 대하여 뚜렷한 증가함수이므로 비선형 회귀 모델에서 과소추정 및 과대추정은 모델의 신뢰성을 낮추는 결정적인 요인이 될 수 있다 (Fig. 2). 본 연구는 기본적인 선형회귀 외에 구간별 선형보간, 다항회귀, 일반화가법모델 (Generalized Additive Model: GAM), logistic curve, gompertz curve를 고려하여 모델 간 검증을 시도하였다 (Table 1).
Table 1
Statistical models considered for ventilation estimation
| Type of regression | Equation |
| Linear | |
| Polynomial | |
| Generalized Additive Model | |
| Logistic curve | |
| Gompertz curve | |
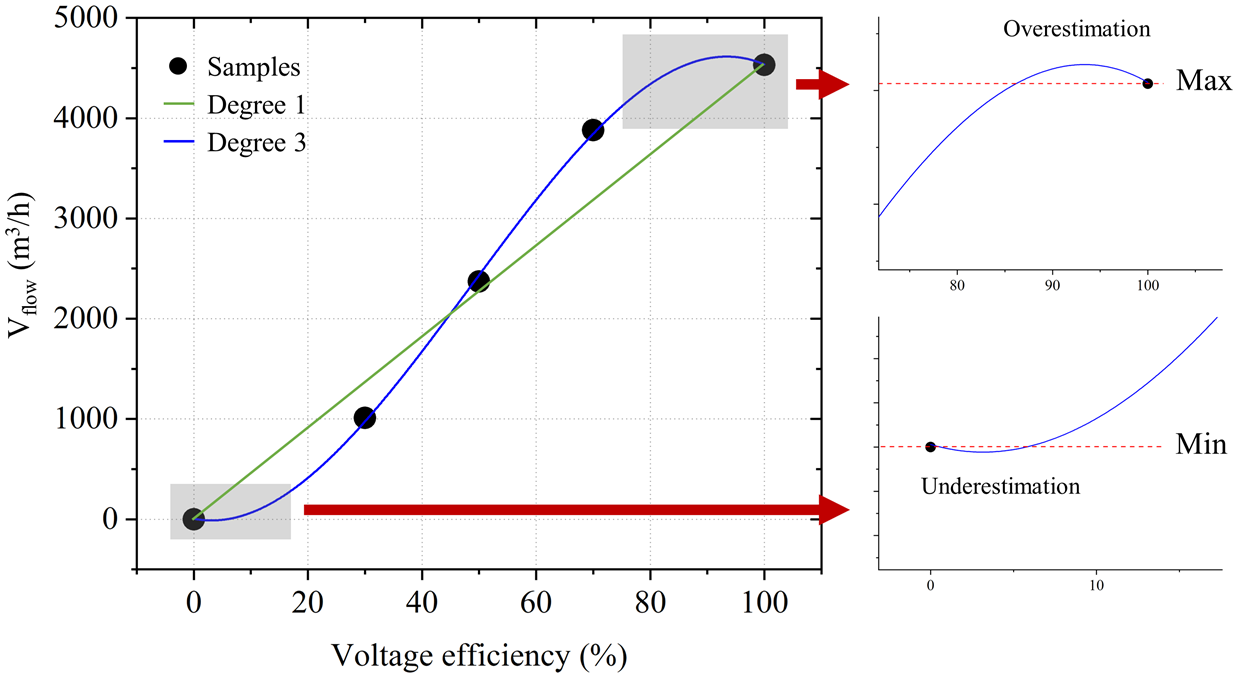
Fig. 2
Examples of linear (green) and nonlinear regression (blue) graphs including underestimate and overestimate
선형회귀는 획득한 데이터로부터 각 변수가 선형 관계에 있음을 가정하여 추정식을 계산하는 고전적인 기법이다 (식 (3)). 최소제곱법에 의해 회귀 계수를 구하고 1차 (Degree 1) 방정식으로 모델링하여 결측구간에 대한 환기량을 추정할 수 있다. 여기서  는 절편,
는 절편,  는 각 독립변수
  의 회귀 계수,
  은 오차항이며 평균이
  이고 분산이
  인 정규분포를 따른다 (
 ). 선형보간 (Linear spline)은 각 구간의 시작점과 끝점을 연결하여 1개 이상의 다중선으로 나타내는 기법이다. 데이터가 비선형일 때 단순 선형회귀에 비해 결측값을 더 잘 모사할 수 있으나 구간을 너무 많이 설정할 경우 과대적합의 우려가 존재한다.
다항회귀는 실측값이 비선형으로 나타날 때 추정치를 알기 위해 적용할 수 있는 매우 보편적인 기법이다. 다항회귀는 2차 이상의 방정식으로 나타낼 수 있고, 변수를 치환함으로써 선형회귀로의 전환이 가능하다 (식 (4)). 선형회귀와 마찬가지로 최소제곱법을 이용하여 쉽게 각 회귀 계수를 추정할 수 있지만, 일반적으로 모델의 복잡도가 증가할수록 편차는 낮아지고 분산이 높아지며 그래프가 비정상적으로 추정될 가능성이 있다 (Lever et al., 2016). 높은 전압의 환기량은 이론적으로 낮은 전압의 환기량보다 반드시 높아야 하고 그 반대도 성립되어야 한다. 선형회귀와 다르게 다항회귀로 추정된 값은 적용하는 차수에 따라서 전술한 명제를 위반하는 결과를 동반할 수 있다. 즉, 과대적합으로 인해 전압효율 100% 이하에서 100%보다 더 많은 환기량을 과대추정하거나 최소 환기량보다 적게 과소추정하는 결과가 나오게 된다 (Fig. 2) (Nikolaev et al., 2002). 본 연구에서는 2차 (Degree 2) 및 3차 (Degree 3) 회귀식을 비교하였다.
기존의 선형모델에서 가법성은 유지하되 선형 관계의 데이터를 smooth function ( )을 통해 비선형으로 나타낼 수 있는 일반화가법모델을 선정하였다 (Yoon, 2016) (식 (5)). GAM은 구간별 fitting이 조금 더 매끄러워질 수 있도록 각 독립변수를 함수로 표현하여 모두 합한 모델이다 (Hastie and Tibshirani, 1986). 적용된 함수의 수는 k로 구분하며 다항회귀, GAM의 인자는 선형회귀와 동일하다.
Logistic 곡선은 생물의 증식이나 경제 발전과정을 S형 모양으로 설명하는 곡선이다. 객체의 성장 속도는 현재의 상태가 포화상태에서 멀수록 빠르고 포화상태에 가까울수록 늦어진다는 현상에 기인한다 (Verhulst, 1847). 전압효율 대비 환기량은 필연적인 증가함수 형태를 띠기 때문에 다항회귀의 단점을 보완하고자 선택하였다 (식 (6)).
Gompertz 곡선은 원래 인간의 노화 지점을 추정하기 위해 발전된 함수이다 (Gompertz, 1825). 나이가 들수록 사망에 대한 저항이 작아짐을 표현한 함수로서 현재는 사회과학, 공학, 축산 등 여러 부문에서 널리 사용되는 모델이다 (식 (7)) (Nagula, 2016; Coyne et al., 2017; Pavlov et al., 2018; Abowei et al., 2019). 식에서  는 상한점근선,
  는 곡선의 위치를 결정하는 하한점근선,
  는 곡선의 모양을 결정하는 곡률을 나타낸다.
  축의 시작과 끝에서 각각 0과 1의 결과를 가진다는 특징은 logistic 회귀와 비슷하지만, 곡선의 굴절이 비대칭적이고 그 시점이
  라는 점이 대조적이다 (Park and Lee, 2004). 실제 돈사에서는 전압효율이 1% 해상도로 수집되기에 모델링 결과 역시 동일한 해상도로 출력하였다.
3. 검증 및 추정 환기량 비교
회귀 모델의 적용성을 검증하기 위해 E 돈방에서 측정된 데이터 중 임의의 구간을 제외하는 모든 조합, 즉 결측구간을 점차 감소시켜 각각의 회귀 모형을 비교하였다. 해당 방법을 적용했을 때 단순히 fitting 된 그래프를 시각적으로 판단하여 적절성을 논하기 어렵기에 root mean square error (RMSE), mean absolute percentage error (MAPE)를 평가 기준으로 선정하였으며 산정식은 식 (8), (9) 과 같다 ( : 실측값,
  : 추정값,
  : 실측값 수).
실제 육성돈사에서 모니터링한 전압효율에 오차율이 가장 적은 상위 3개의 통계모델 적용 후, 각 모델에 따른 추정 환기량을 산정⋅비교하였다. 육성돈의 사육 기간은 입식 후 35일 (840시간)이며 실측 환기량과 비교하기 위하여 1분 단위의 데이터를 1시간 데이터로 변환하고 이에 따른 시간별 환기량을 추정하였다. 전체 평가 프로세스는 Fig. 3과 같으며 모델 적용 및 검증에는 open source 기반의 통계 프로그래밍 언어인 R (version 3.5.1)을 이용하였다. 모델 적용에는 R의 easynls library를 이용하였고 logistic curve의 인자는  ,
,  ,
,  , gompertz curve의 인자는
  ,
,  ,
,  로 설정하였다.

Fig. 3
Comparison of regression models and selection process for estimating ventilation rate
Ⅲ. 결과 및 고찰
1. 환기량 실측 결과
소형 환기량 측정 장치를 이용한 A~E 돈방의 환기량 실측 결과를 Fig. 4에 도시하였다. 30%~100% 구간의 전압효율에서 진행하였고 평균 환기량은 A 돈방의 경우 1,011~4,530 m3/h, B 돈방은 1,084~4,485 m3/h, C 돈방은 913~4,136 m3/h, D 돈방은 960~4,429 m3/h, E 돈방은 909~4,397 m3/h로 조사되었다. 전압효율 30%에서 E 돈방이 가장 낮은 환기량 (909 m3/h)을 보였고 전압효율 100%에서 A 돈방이 가장 높은 환기량 (4,530 m3/h)을 갖는 것으로 분석되었다. 동일한 전압효율에 따라 각 환기팬 별 성능이 상이하였으며 전체적으로 비선형의 관계가 나타났다.
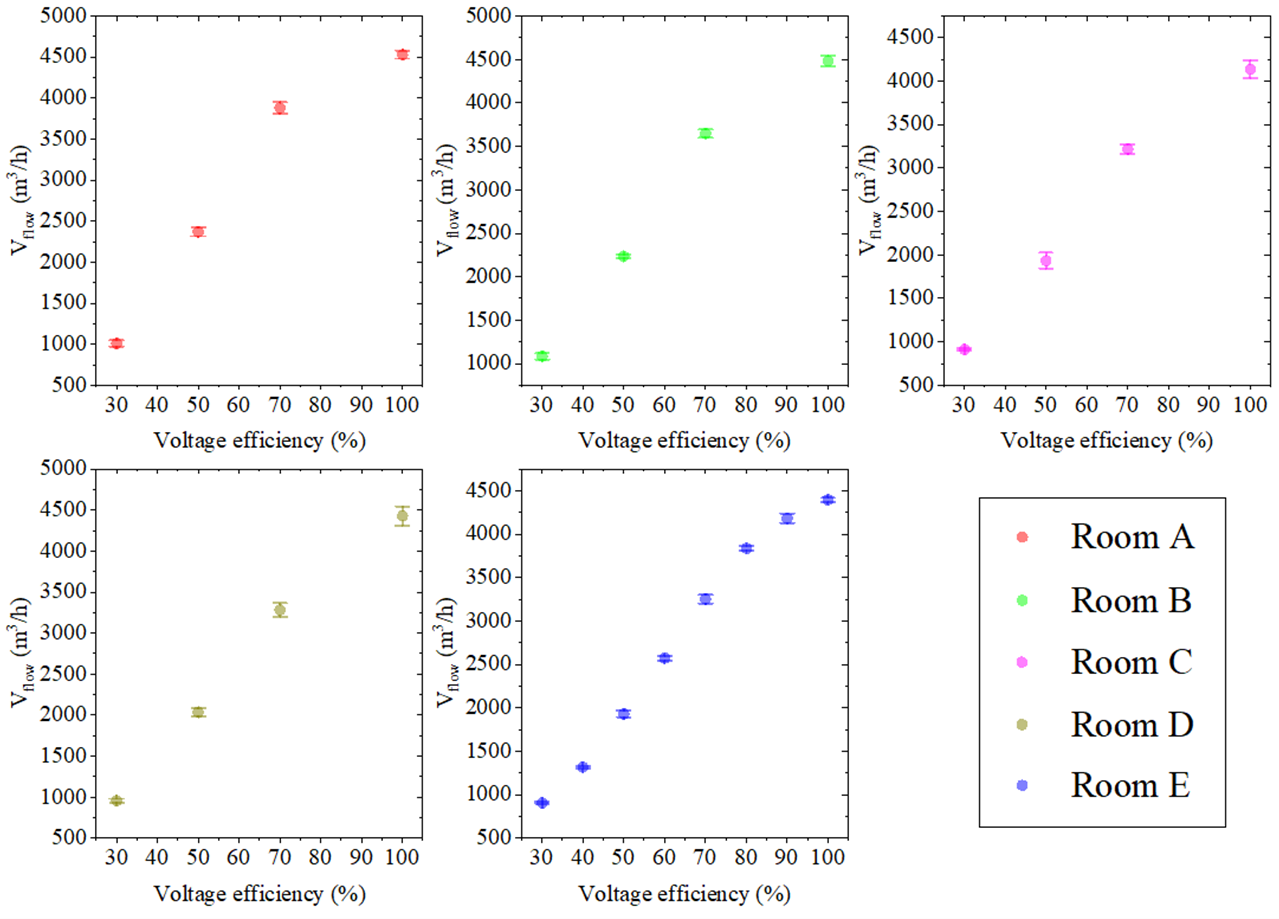
Fig. 4
Result of ventilation rate measurement (room A, B, C, D, and E)
2. 모델 비교
모형이 실제 환기량을 얼마나 잘 예측하는지 비교하기 위해 E 돈방 환기량 데이터에서 전압효율 최솟값 (30%)과 최댓값 (100%)을 고정하고 임의로 4개의 구간을 제외한 뒤 예측정확도를 평가하였다. 총 경우의 수는  이다 (Table 2).
Table 2
4 points group for model evaluation
| Group | Voltage Efficiency (%) |
| 30 | 40 | 50 | 60 | 70 | 80 | 90 | 100 |
| 1 | ○ | ○ | ○ | | | | | ○ |
| 2 | ○ | ○ | | ○ | | | | ○ |
| 3 | ○ | ○ | | | ○ | | | ○ |
| 4 | ○ | ○ | | | | ○ | | ○ |
| 5 | ○ | ○ | | | | | ○ | ○ |
| 6 | ○ | | ○ | ○ | | | | ○ |
| 7 | ○ | | ○ | | ○ | | | ○ |
| 8 | ○ | | ○ | | | ○ | | ○ |
| 9 | ○ | | ○ | | | | ○ | ○ |
| 10 | ○ | | | ○ | ○ | | | ○ |
| 11 | ○ | | | ○ | | ○ | | ○ |
| 12 | ○ | | | ○ | | | ○ | ○ |
| 13 | ○ | | | | ○ | ○ | | ○ |
| 14 | ○ | | | | ○ | | ○ | ○ |
| 15 | ○ | | | | | ○ | ○ | ○ |
모형평가 기준으로 고려된 RMSE와 MAPE는 낮을수록 해당 모델이 좋은 예측성능을 보이는 것으로 판단할 수 있으며, 모델에 따른 두 기준의 결과는 서로 유사한 수준으로 도출되었다. 분석 결과, logistic curve > degree 3 > gompertz curve > linear spline > degree 2 > GAM (k=4) > degree 1 > GAM (k=3) 순으로 예측성능이 우수한 것으로 분석되었고 (Table 3), 이 중 logistic 곡선과 degree 3의 예측성능이 다른 모형에 비해 상대적으로 우수하였다. 추가로 결측구간을 늘려 임의로 3개의 구간을 제외한 뒤 같은 방법으로 예측정확도를 평가하였다 (Table 4). 총 경우의 수는  이다.
이다.
Table 3
Results of RMSE and MAPE after excluding any 4 sections. Each value includes the mean and standard deviation
| Type of regression | RMSE (Mean ± SD) | MAPE (Mean ± SD) |
| Linear | Degree 1 | 206.15 | ±59.33 | 6.85 | ±1.45% |
| Spline | 153.58 | ±70.24 | 5.34 | ±1.94% |
| Polynomial | Degree 2 | 202.98 | ±66.91 | 7.97 | ±3.48% |
| Degree 3 | 61.48 | ±55.94 | 2.24 | ±2.98% |
| GAM | k=3 | 213.88 | ±61.40 | 7.66 | ±2.69% |
| k=4 | 203.56 | ±64.74 | 7.25 | ±2.31% |
| Logistic curve | 60.17 | ±21.88 | 2.16 | ±1.07% |
| Gompertz curve | 134.19 | ±51.07 | 5.14 | ±2.56% |
Table 4
Results of RMSE and MAPE after excluding any 3 sections. Each value includes the mean and standard deviation
| Type of regression | RMSE (Mean ± SD) | MAPE (Mean ± SD) |
| Linear | Degree 1 | 186.69 | ±60.15 | 6.53 | ±2.13% |
| Spline | 111.50 | ±59.74 | 4.01 | ±2.10% |
| Polynomial | Degree 2 | 174.20 | ±49.91 | 7.02 | ±2.95% |
| Degree 3 | 37.20 | ±12.81 | 1.21 | ±0.72% |
| GAM | k=3 | 184.33 | ±56.47 | 6.90 | ±2.44% |
| k=4 | 88.77 | ±81.24 | 3.23 | ±2.61% |
| Logistic curve | 48.86 | ±18.26 | 1.73 | ±0.76% |
| Gompertz curve | 109.15 | ±35.23 | 4.21 | ±1.81% |
구간이 4개에서 5개로 증가하면서 모든 모형에서 RMSE와 MAPE가 감소하였다. 예측성능을 순서대로 나열하면 degree 3 > logistic curve > GAM (k=4) > gompertz curve > linear spline > degree 2 > GAM (k=3) > degree 1이다. 앞의 결과와 유사하게 logistic 곡선과 degree 3의 예측성능이 다른 모형에 비해 상대적으로 우수하였고 구간이 증가하면서 degree 3이 logistic 곡선에서 비해 우수하게 나타났다.
이제 임의로 2개의 구간을 제외한 뒤 예측정확도를 평가하면 총 경우의 수는  이며 그 결과를 Table 5에 정리하였다. 위의 결과와 유사하게 구간이 증가하면서 RMSE와 MAPE 모두 감소하였으며 degree 3, logistic curve, GAM (k=4)의 예측성능이 다른 모형에 비해 상대적으로 우수하게 평가되었다.
Table 5
Results of RMSE and MAPE after excluding any 2 sections. Each value includes the mean and standard deviation
| Type of regression | RMSE (Mean ± SD) | MAPE (Mean ± SD) |
| Linear | Degree 1 | 167.75 | ±70.30 | 6.21 | ±3.01% |
| Spline | 83.57 | ±46.51 | 3.15 | ±2.09% |
| Polynomial | Degree 2 | 153.26 | ±49.17 | 6.37 | ±3.15% |
| Degree 3 | 31.98 | ±14.51 | 1.03 | ±0.44% |
| GAM | k=3 | 162.87 | ±55.91 | 6.35 | ±2.90% |
| k=4 | 38.57 | ±23.01 | 1.69 | ±1.28% |
| Logistic curve | 39.97 | ±20.68 | 1.41 | ±0.69% |
| Gompertz curve | 92.54 | ±32.91 | 3.63 | ±1.62% |
마지막으로 임의의 1개의 구간을 제외한 뒤 예측정확도를 평가하면 총 경우의 수는  이며 결과는 Table 6과 같다. 1개의 구간이 제외된 결과 다른 조합에 비하여 편차가 눈에 띄게 줄어들었으며 오차율 역시 가장 적게 분석되었다.
Table 6
Results of RMSE and MAPE after excluding any 1 sections. Each value includes the mean and standard deviation
| Type of regression | RMSE (Mean ± SD) | MAPE (Mean ± SD) |
| Linear | Degree 1 | 158.37 | ±2.05 | 4.78 | ±0.50% |
| Spline | 21.69 | ±13.76 | 0.32 | ±0.30% |
| Polynomial | Degree 2 | 119.71 | ±1.61 | 5.61 | ±0.23% |
| Degree 3 | 20.02 | ±1.45 | 0.60 | ±0.08% |
| GAM | k=3 | 124.02 | ±6.28 | 4.97 | ±0.25% |
| k=4 | 18.71 | ±2.35 | 0.79 | ±0.02% |
| Logistic curve | 32.50 | ±1.07 | 1.36 | ±0.08% |
| Gompertz curve | 73.96 | ±1.24 | 3.38 | ±0.12% |
전압효율 구간을 총 3개만 선택할 경우 부정방정식의 문제로 3차식을 세울 수 없고 logistic curve와 gompertz curve의 모수도 가중 최소제곱법으로 추정하는 데 어려움이 있으므로, 4개 구간 이하는 모델링에 고려하지 않았다. 위 결과를 토대로 정리하면 전체적으로 degree 3, GAM (k=4), logistic 곡선이 다른 모형에 비해 예측력에 있어 안정적이고 우수함을 알 수 있다.
예측성능이 우수한 상위 3가지 모형식 (degree 3, GAM (k=4), logistic curve)을 A~D 돈방 데이터에 적용한 결과를 비교하여 나타내었다 (Fig. 5, Table 7). 가장 안정적인 결과를 보였던 degree 3은 A, B 돈방에서 전압효율 100%의 환기량보다 높은값을 나타내어 과대추정하는 문제가 발생하였다. GAM (k=4)는 Room B, C, D의 경우 전압효율 70%에 해당하는 구간을 과소 추정하였으며 Room A에서 logistic curve보다 MAPE가 약간 우수했으나 전체적으로 3가지 모델 중 예측정확도가 가장 낮았다. 따라서 A~D 돈방의 환기량을 예측한다면 logistic 곡선이 안정적이며 예측정확도 역시 높다고 할 수 있다.
Table 7
Performance evaluation of top 3 models (Degree 3, logistic curve, GAM (k=4)) for A~D pig room ventilation rate prediction
| Type | Room |
| A | B | C | D |
| RMSE | MAPE | RMSE | MAPE | RMSE | MAPE | RMSE | MAPE |
| Degree 3 | 0 | 0.0% | 0 | 0.0% | 0 | 0.0% | 0 | 0.0% |
| GAM (k=4) | 55 | 1.5% | 96 | 2.3% | 101 | 3.1% | 65 | 1.9% |
| Logistic curve | 48 | 2.2% | 47 | 2.1% | 28 | 1.5% | 3 | 0.2% |
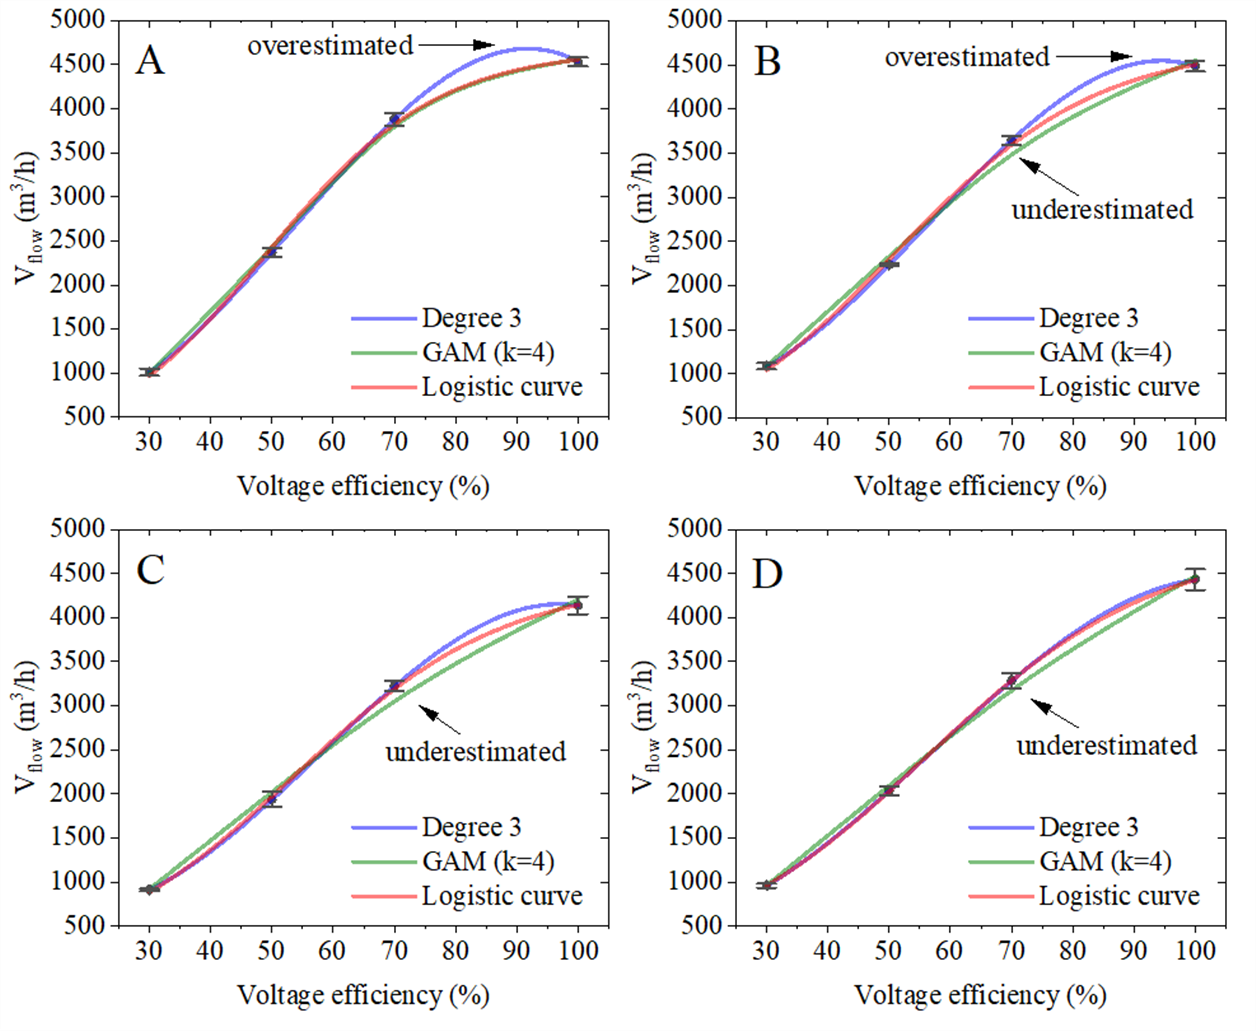
Fig. 5
Ventilation regression graph in A~D pig room considering 3 models (Degree 3, GAM (k=4), logistic curve)
3. 모델에 따른 육성기간 환기량 추정
본 연구에서 고려된 통계모델을 통한 육성시기 추정 환기량 및 degree 1 대비 환기량 차이를 Fig. 6, Table 8에 나타내었다. 전체 통계모델 중 degree 1에 의한 환기량이 가장 적고 degree 2에 의한 환기량이 최댓값으로 분석되었다. 오차율이 큰 선형모델 및 과대추정의 오류가 있는 degree 3을 제외하면 4개 돈방 중 3개 돈방 (A, C, D)에서 logistic curve에 의한 추정 환기량이 가장 적은 것으로 나타났다. logistic 곡선에 따른 추정 환기량은 degree 1 대비 1.6%~4.1%로 더 크게 산정되었다.
Table 8
Estimated ventilation differences (%) by regression models compared to degree 1
| Regression | Room A | Room B | Room C | Room D |
| Degree 1 | - | - | - | - |
| Linear spline | 3.2 | 2.7 | 1.7 | 1.6 |
| Degree 2 | 5.8 | 4.9 | 4.7 | 3.4 |
| Degree 3 | 4.4 | 4.0 | 2.1 | 1.9 |
| GAM (k=3) | 4.6 | 3.3 | 2.7 | 2.2 |
| GAM (k=4) | 4.3 | 3.3 | 2.6 | 2.1 |
| Logistic curve | 4.1 | 3.8 | 2.5 | 1.6 |
| Gompertz curve | 4.7 | 4.2 | 3.5 | 2.4 |
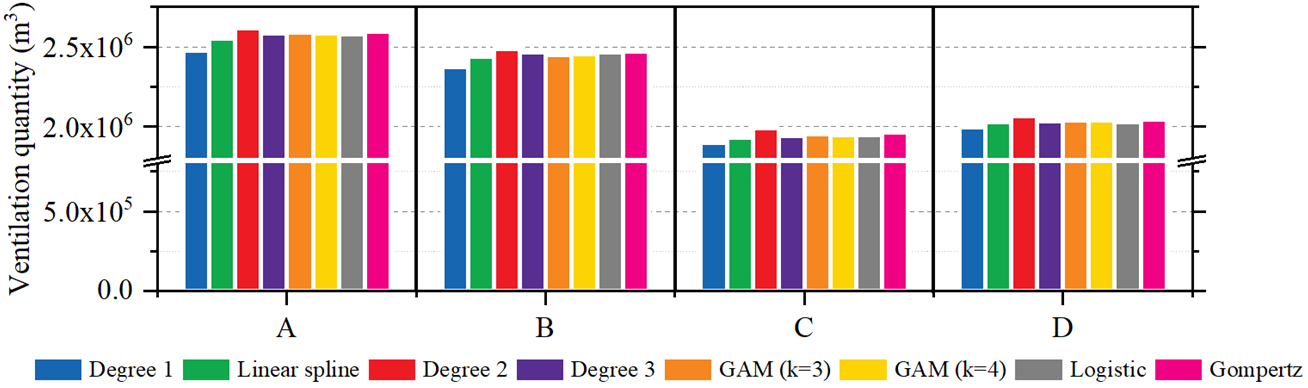
Fig. 6
Estimated ventilation quantity bin graph of A~D pig room according to the regression models for 35 days
Ⅳ. 결 론
밀폐형 돈사의 환기량 추정을 위해 실측 데이터를 기반으로 다양한 통계모델을 비교하여 최적의 추정 모델을 선정하였다. 환기량 추정은 국가 오염물질 배출량 산정과 직접적인 관계가 있으므로 오차율이 적은 최적의 모델을 찾고 적용하는 게 중요하다. 선형회귀, 선형보간, 다항회귀, logistic curve, GAM, gompertz curve가 상호 비교되었으며 과대적합 된 모델은 제외 후 RMSE, MAPE 값으로 순위를 산정하였다. 평가 결과 3차 회귀식의 경우 오차율이 가장 적었으나 일정 구간에서의 전압효율 100% 이상의 과대추정 문제가 발생하였다. 최종적으로 logistic 곡선이 가장 안정적이고 우수한 것으로 분석되었다. 고려된 전체 모델에 의한 추정 환기량을 산정해본 결과 1차, 2차 방정식 (degree 1, degree 2)가 각각 최솟값, 최댓값으로 분석되었고 오차율이 크고 과대평가된 모델을 제외하면 logistic 곡선에 의한 환기량이 가장 적게 추정되었다. 각 모델 간 추정 환기량은 미미한 비율로 차이를 보이지만, 국가 전체 사육두수에 대입해본다면 암모니아 배출량의 차이는 매우 비대해질 것으로 판단한다. 관측 구간의 수를 충분히 늘려 추정하는 것이 환기량을 가장 정확히 산정하는 이상적인 방법이나, 실제 현장에서는 제한적인 상황이 많으므로 결측구간이 필연적으로 존재할 수밖에 없는 상황에서 본 연구의 모델 선정 과정 이상의 고차원의 모델 적용 연구가 추후 진행되어야 할 것으로 사료된다.
감사의 글
본 연구는 농촌진흥청 연구사업 (세부과제번호: PJ01385002)의 지원으로 수행되었으며 이에 감사드립니다.
REFERENCES
A. J. A. Aarnink, A. Keen, J. H. M. Metz, L. Speelman and M. W. A. Verstegen, Journal of Agricultural Engineering Research, Ammonia emission patterns during the growing periods of pigs housed on partially slatted floors., 62(2); 105-116 (1995)10.1006/jaer.1995.1069
A. J. A. Aarnink, A. J. Van Den Berg, A. Keen, P. Hoeksma and M. W. A. Verstegen, Journal of Agricultural and Engineering Research, Effect of slatted floor area on ammonia emission and on the excretory and lying behaviour of growing pigs., 64(4); 299-310 (1996)10.1006/jaer.1996.0071
M. F. N. Abowei, A. C. Akinwande and J. G. Akpa, European Journal of Engineering Research and ScienceModelling cow-dung and grass-clippings isothermal continuous stirred co-digester for biogas production using modified Gompertz rate equation., 4(3); 196-202 (2019)10.24018/ejers.2019.4.3.1195
Archives American Society of Heating, Refrigerating and Air-Conditioning Engineers (ASHRAE), 1993, ASHRAE Handbook: fundamentals. (1993)
T. R. Anthony, R. Altmaier, J. H. Park and T. M. Peters, Journal of Occupational and Environmental Hygiene, Modeled effectiveness of ventilation with contaminant control devices on indoor air quality in a swine farrowing facility., 11(7); 434-449 (2014)10.1080/15459624.2013.87518624433305PMC4753560
N. O. Breum, H. Takai and H. B. Rom, Transactions of the American Society of Agricultural EngineersUpward vs. downward ventilation air flow in a swine house., 33(5); 1693-1699 (1990)10.13031/2013.31528
K. D. Casey, R. S. Gates, E. F. Wheeler, H. Xin, Y. Liang, A. J. Pescatore and M. J. Ford, Journal of Applied Poultry Research, On-farm ventilation fan performance evaluations and implications., 17(2); 283-295 (2008)10.3382/japr.2006-00055
J. M. Coyne, K. Matilainen, D. P. Berry, M. L. Sevon-Aimonen, E. A. Mäntysaari, J. Juga, T. Serenius and N. McHugh, Journal of Animal Breeding and Genetics, Estimation of genetic (co)variances of Gompertz growth function parameters in pigs., 134(2); 136-143 (2017)10.1111/jbg.1223727625008
O. Ecim-Djuric and G. Topisirovic, Energy and Buildings, Energy efficiency optimization of combined ventilation systems in livestock buildings., 42(8); 1165-1171 (2010)10.1016/j.enbuild.2009.10.035
S. B. Fuller, A. Sands, A. Haggerty, M. Karpelson and R. J. Wood, In Proc. IEEE International Conference on Robotics and Automation,Estimating attitude and wind velocity using biomimetic sensors on a microrobotic bee.; 1374-1380 (2013)10.1109/icra.2013.663075027295638
B. Gompertz, Proceedings of the Royal Society of LondonOn the nature of the function expressive of the law of human mortality, and on a new mode of determining the value of life contingencies., 2; 252-253 (1825)10.1098/rspl.1815.0271
T. Hastie and R. Tibshirani, Statistical ScienceGeneralized additive models., 1(3); 297-310 (1986)10.1214/ss/1177013604
A. J. Heber, J. Q. Ni, T. T. Lim, C. A. Diehl, A. L. Sutton, R. K. Duggirala, B. L. Haymore, D. T. Kelly and V. I. Adamchuk, Transactions of the American Society of Agricultural EngineersEffect of a manure additive on ammonia emission from swine finishing buildings., 43(6); 1895-1902 (2000)10.13031/2013.309425473006PMC4286052
J. Holt, N. E. Selin and S. Solomon, Environmental Science and TechnologyChanges in inorganic fine particulate matter sensitivities to precursors due to large-scale us emissions reductions., 49(8); 4834-4841 (2015)10.1021/acs.est.5b0000825816113
R. W. Kim, I. B. Lee, T. H. Ha, U. H. Yeo, S. Y. Lee, M. H. Lee, G. Y. Park and J. G. Kim, Journal of Korean Society of Agricultural Engineers, Development of CFD model for predicting ventilation rate based on age of air theory using thermal distribution data in pig house., 59(6); 61-71, (in Korean). (2017)10.5389/KSAE.2017.59.6.061
J. Lever, M. Krzywinski and N. Altman, Nature MethodsPoints of significance: Model selection and overfitting., 13(9); 703-704 (2016)10.1038/nmeth.3968
T. T. Lim, A. J. Heber, J. Q. Ni, D. C. Kendall and B. T. Richert, Transactions of the American Society of Agricultural EngineersEffects of manure removal strategies on odor and gas emissions from swine finishing., 47(6); 2041-2050 (2004)10.13031/2013.17801
K. Moophayak, K. L. Sukontason, H. Kurahashi, R. C. Vogtsberger and K. Sukontason, Parasitology Research, Evaluation of an I-box wind tunnel model for assessment of behavioral responses of blow flies., 112(11); 3789-3798 (2013)10.1007/s00436-013-3566-123979494
M. Nagula, Journal of Statistics and Management Systems, Forecasting of fuel cell technology in hybrid and electric vehicles using Gompertz growth curve., 19(1); 73-88 (2016)10.1080/09720510.2014.1001601
J. Q. Ni, A. J. Heber, T. T. Lim, C. A. Diehl, R. K. Duggirala, B. L. Haymore and A. L. Sutton, Journal of Environmental Quality, Ammonia emission from a large mechanically-ventilated swine building during warm weather., 29(3); 751-758 (2000)10.2134/jeq2000.00472425002900030010x
N. Nikolaev, L. M. De Menezes and H. Iba, In Proc. Congress on Evolutionary Computation,Overfitting avoidance in genetic programming of polynomials.; 1209-1214 (2002)10.1109/CEC.2002.100441527295638
National Institute of Environmental Research (NIER),, National Air Pollutants Emission Service,,
http://airemiss.nier.go.kr (accessed 11.20.2019). (2016)
B. W. Oh, S. W. Lee, H. C. Kim and I. H. Seo, Journal of the Korean Society of Agricultural Engineers, Analysis of working environment and ventilation efficiency in pig house using computational fluid dynamics., 61(2); 85-95, (in Korean). (2019)10.5389/KSAE.2019.61.2.085
S. G. Park and S. U. Lee, The Kips Transactions Part DA software reliability growth model based on Gompertz growth curve., 11D(7); 1451-1458, (in Korean). (2004)10.3745/kipstd.2004.11d.7.1451
N. Pavlov, G. Spasov, A. Rahnev and N. Kyurkchiev, International Electronic Journal of Pure and Applied Mathematics, A new class of Gompertz–type software reliability models., 12(1); 43-57 (2018)10.12732/iejpam.v12i1.4
L. D. Schiferl, C. L. Heald, J. B. Nowak, J. S. Holloway, J. A. Neuman, R. Bahreini, I. B. Pollack, T. B. Ryerson, C. Wiedinmyer and J. G. Murphy, Journal of Geophysical Research, An investigation of ammonia and inorganic particulate matter in california during the calnex campaign., 119(4); 1883-1902 (2014)10.1002/2013jd02076525855820
I. H. Seo, I. B. Lee, S. W. Hong, H. S. Hwang, J. P. Bitog, J. I. Yoo, K. S. Kwon, T. H. Ha and H. T. Kim, Journal of The Korean Society of Agricultural Engineers, Development of a CFD model to study ventilation efficiency of mechanically ventilated pig house., 50(1); 25-37, (in Korean). (2008)10.5389/ksae.2008.50.1.025
M. Sharma, S. Kishore, S. N. Tripathi and S. N. Behera, Journal of Atmospheric Chemistry, Role of atmospheric ammonia in the formation of inorganic secondary particulate matter: A study at Kanpur, India., 58(1); 1-17 (2007)10.1007/s10874-007-9074-x
J. D. Simmons and B. D. Lott, Applied Engineering in AgricultureReduction of poultry ventilation fan output due to shutters., 13(5); 671-673 (1997)10.13031/2013.21646
L. Tang, L. Zhao, Y. Yang and E. Lefeuvre, IEEE/ASME Transactions on MechatronicsEquivalent circuit representation and analysis of galloping- based wind energy harvesting., 20(2); 834-844 (2015)10.1109/tmech.2014.230818227295638
S. H. Yoon, Korean Data and Information Science SocietyGenerating high resolution of daily mean temperature using statistical models., 27(5); 1215-1224 (2016)10.7465/jkdi.2016.27.5.1215
P. F. Verhulst, Mémoires de l’Académie Royale des Sciences, des Lettres et des Beaux-Arts de BelgiqueDeuxième mémoire sur la loi d’accroissement de la population., 20; 1-32 (1847)
Verification of Environmental Technologies for Agricultural Production (VERA),, Test Protocol for Livestock Housing and Management Systems,, 48 (2011)
J. Zhu, L. Jacobson, D. Schmidt and R. Nicolai, Applied Engineering in AgricultureDaily variations in odor and gas emissions from animal facilities., 16(2); 153-158 (2000)10.13031/2013.5067