

Ⅰ. Introduction
The reclaimed land area in Korea is about 135,100 ha, accounting for about 9% of the total cultivated area, and as the cultivated area continues to decrease, the importance of reclaiming land is increasing (Rural Development Administration and National Institute of Crop Science, 2014; Korean Statistical Information Service, 2019). In addition, although rice paddies are gradually being converted to farmland and horticultural land (Korean Statistical Information Service, 2019), soil salinity of reclaimed lands is high because these lands were reclaimed nearby river estuaries or coasts, so they are difficult to use for agricultural purposes. Accordingly, most of the reclaimed lands are left as bare lands, as habitat for halophytes, or they are used as rice paddies (National Institute of Crop Science, 2010).
However, Reclaimed lands are still vulnerable to salinization by capillary rise, even after initial desalination. (National Institute of Crop Science, 2013). The salinization lowers the efficiency of prior desalination and makes it difficult to use farmland. However, salinization is difficult to predict because it involves a wide variety of influencing factors, like salinity of soil and groundwater, ground permeability, soil water content, groundwater level (Singh, 2018; Xie et al., 2019).
Recently, it is possible to simulate the salinization of the ground by using models and software such as SALTMED, UPFLOW, and CHEMFLO. Most of these are distributed free, but expert personnel must simulate according to site characteristics. Among them, the CHEMFLO model is widely used in research on capillary flow in soil because it is possible to conveniently simulate the movement and concentration change of material over time in non-uniform layered soils (Herrada et al., 2014; Seo et al., 2018), Studies on prediction of salinized areas through a probabilistic approach (Seydehmet et al., 2018), developing a salinization model through the capillary test (Seo et al., 2018) were conducted. In addition, a study on the change of groundwater level and salinized area according to sea level rise by climate change scenario was also conducted (Jung et al., 2020). With the recent development of unmanned aerial vehicle technology, studies on the prediction or mapping of soil salinity using digital image have also been conducted (Huang et al., 2015; Guo et al., 2020; Xu et al., 2020). In the above studies, interpolation of actual salinity data or the relationship between image color and salinity were investigated. However, the study on predicting the surface salinity concentration at a specific time, providing a convenient formula in consideration groundwater levels, the initial water content conditions by depth has not been conducted yet.
Therefore, in this study, database were created based on the simulation results of the CHEMFLO model according to various conditions such as the soil characteristics of the reclaimed lands such as the initial surface water content and salinity concentration, groundwater level, and salinity concentration of groundwater. Based on this, a method for predicting the surface salinity concentration in consideration of the initial water content profile of the reclaimed land or the surface layer was developed. Consequently, a basic relational equation for the prediction of the surface salinity concentration in the reclaimed land was derived, and the effects of each condition on salinization were discussed.
Ⅱ. Materials & Methods
1. Model selection & Modeling environment settings
In this study, A model should be selected considering the unsaturated characteristics of the soil, because it is necessary to simulate the salinization according to soil water contents. The selected model is the CHEMFLO model developed by Nofziger et al. (1989), a one-dimensional model that can simulate the effects of soil hydraulic properties on the movement of water and chemicals within unsaturated soil. The CHEMFLO model provides a library for physical properties by soil classification, saturated permeability coefficients ( ), unsaturated properties (Van Genuchten, 1980). The physical properties of the soil were determined by the default value of Silt Loam, which accounts for 76.7% of the reclaimed land surface (Rural Development Administration and National Institute of Crop Science, 2009).
  , soil water characteristic curve (SWCC), organic content, unit weight, and water characteristic function (Van Genuchten model) were shown in Table 1 below, acquired from the CHEMFLO library “Silt Loam”.
Table 1
Characteristics of modeled soils
| Water characteristic function (Van Genuchten) | Organic carbon (g/g) | Bulk density (t/m3) | |
| Ks (cm/hr) | 0.45 | 0.014 | 1.55 |
| θs | 0.45 | ||
| θr | 0.067 | ||
| α (1/cm) | 0.02 | ||
| n | 1.41 | ||
The chemical properties of salts in the model are established considering the diffusion coefficients and dispersion properties when dissolved. The diffusion coefficient was 0.23 cm2/hr, degradation and production constants were set to zero, referring to Seo et al. (2011). The solubility of NaCl (Sodium chloride), a target substance, is 360 g/L at 25℃ (Haynes et al., 2017). However, the soil salinity is measured by diluting with coagulated salts beyond solubility, so the upper limit was not considered. Mesh composition and convergence conditions are based on the default of the model, but 0.05 hour time interval andthe 0.001 convergence criterion were set considering the length of the simulated period in this study.
2. Development of prediction equation for surface soil salinity
To construct the modeling case, soil water content and groundwater level were considered. Results of pre-simulation showed no upward capillary flow due to differences in matric potential when the surface water contents was 40% or more. Thus, the initial surface water content conditions were considered by segmenting 5-35%, at 5% intervals. The groundwater level conditions were set from 0.5 m to 1.5 m, at intervals of 0.1 m, referring to the results of a survey of reclaimed land by the Korea Rural Community Corporation (2008). Depending on the capillary rise, the time at which the water content distribution reaches equilibrium can be calculated by case, and this time was designated to the ‘capillary rising time’. The water contents profile at the capillary rising time is considered as the initial water contents condition of simulation. Salt that rises to the surface layer upon salinization can be classified into salts that have been dissolved in soil and groundwater, respectively. Therefore, the change in the salinity of the surface layer at a specific time by salinization can be expressed as following equation (1).
Where  is surface salinity after time
  (dS/m),
  is surface salinity by rising of salt in the soil at time
  (dS/m) and
  is surface salinity by rising of salt in the groundwater at
  (dS/m).
In order to derive the prediction equation, the salinization by the rising of initial salt concentration and the groundwater salt concentration were simulated. Rising of salt in the soil, salt in the groundwater were simulated separately to determine the effects of each, and the salt concentration of the other was set to zero. The initial salinity of soil and groundwater were set as the coefficients of the equation to consider various conditions of soil and groundwater in the actual reclaimed land.
Ⅲ. Results & Discussion
1. Calculation of the capillary rising time according to initial soil water content and groundwater level
From the results of the simulation according to initial soil water contents and the groundwater level conditions, the capillary rising time was calculated as following Table 2.
Table 2
Capillary rising time according to initial soil water content, groundwater level conditions (hr)
The capillary rising time increased exponentially as the groundwater level deepened, and the lower the initial soil water content, it takes the more time for the soil water content profile to reach equilibrium. In the case of 35% soil water content, if the groundwater level is more than 0.9 m, capillary rise was not observed. This is because as soil water content increases, the matric potential of the soil decreases and the upward capillary flow is suppressed. In accordance with the above results, the calculation equation for capillary rising time was derived as equation (2). The form of equation was determined by the combination of the easiest-to-use polynomial, exponential functions, and the least error coefficients and exponents were selected using Microsoft Excel’s add-in solver.
Where  is capillary rising time (hour),
  is groundwater level (m), and
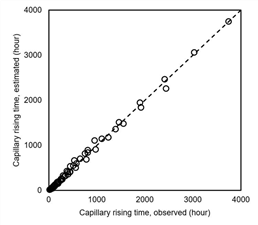
  is initial soil water content (%, volumetric). The above calculation equation was tested as shown in Figure 1, and the coefficient of determination (R2) was 0.9955.
2. Changes in the surface soil salinity due to the rise of the initial salt in the soil
Using the CHEMFLO model, the rise of the initial salt in the soil was simulated by groundwater level and initial soil water content conditions. Fig. 2 (a) illustrates changes in the surface salinity under conditions of 0.5 m, 1.0 m, 1.5 m groundwater level and 10% soil water content. The surface salinity increased due to the continuous capillary rise. It took longer to rise to the same salinity when the groundwater level deepened. Fig. 2 (b), (c) is surface salinity for cases of the initial soil water content is 20% and 30%, respectively.
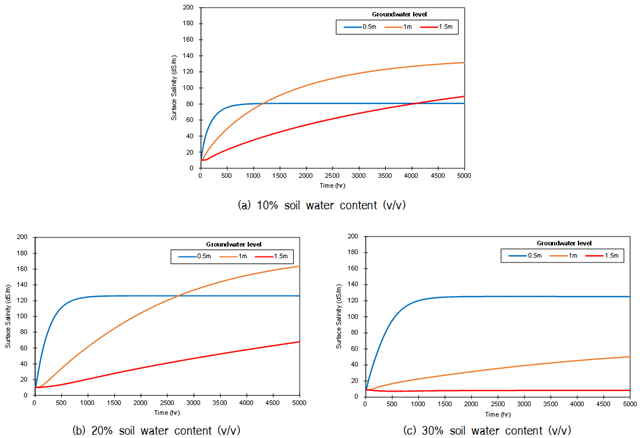
Accordingly, the prediction equation was established as shown in equation (3).
Where  is initial surface salinity (dS/m).
  is the time elapsed from capillary rising time (
 ) (hour), and
  are coefficients by groundwater level and initial soil water content. The coefficients of the prediction equation were selected as the least error coefficients in the same way as Equation (2). Additionally, the coefficients for each condition are given in Appendix A. The coefficient of determination (R2) of the prediction equation was calculated as shown in Table 3, the average for the entire case was 0.9816.
APPENDIX A.
Coefficients of prediction equation for each initial surface water content, groundwater level conditions
Table 3
R2 value of the prediction equation for rising of the initial salt in the soil
3. Changes in the surface soil salinity due to the rising of salt in the groundwater
Fig. 3 (a) shows the change in salinity of the surface layer over time at the groundwater level of 0.5, 1, and 1.5 m under 10% water content. The surface salinity increased with proportional to time. The salinity rise slowed as the groundwater level deepened. At Fig. 3 (a) to (c), it could be observed that the time for the surface salinity to start to rise is delayed as the initial water content increases. It is due to the upward capillary flow is suppressed as the water content increases. After that, it was confirmed that the salt contained in the groundwater continued to accumulate into surface layer. In cases of 20%-1.5 m, 30%–1.0 m/1.5 m (water content - groundwater level), no change in the surface salinity was not observed during the modeled time.
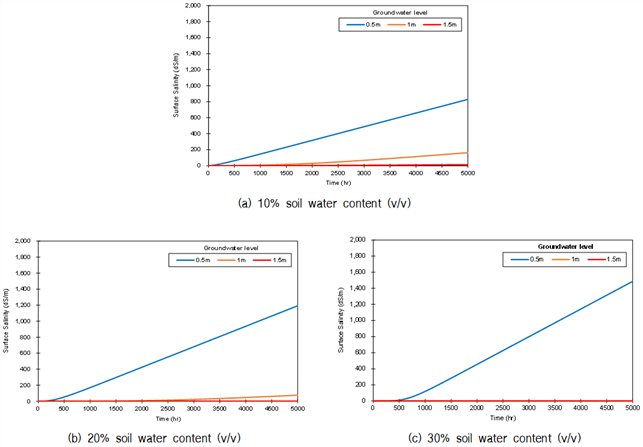
The prediction equation for surface salinity due to the rising in groundwater salinity was derived as shown in the following equation (4).
Where  is the initial salinity of groundwater (dS/m), and
  are coefficients according to groundwater level and initial water content. To enable simpler prediction, a second-order polynomial equation was adopted. Coefficients were selected with the least error, included in Appendix A. R2 of the prediction equation for simulation results are as Table 4, the average was 0.9824.
Table 4
R2 values of prediction equation according to groundwater level and initial surface water content
4. Derivation of surface soil salinity prediction equation
Based on the above equations (3) and (4), the surface salinity prediction equation considering the rising of initial soil salinity, groundwater salinity was derived as shown as following equation (5). The coefficients are included in Appendix (A).
Where  is the time elapsed from capillary rising time (
 ) (hour),
  is surface salinity after time
  (dS/m),
  is surface salinity by rising of salt in the soil at time
  (dS/m),
  is surface salinity by rising of salt in the groundwater at
  (dS/m).
  is initial surface salinity (dS/m),
  is the initial salinity of groundwater (dS/m), and
  ,
, ,
, ,
, ,
, are coefficients by groundwater level and initial soil water content.
As an example of application of equation (5), the modeling results and prediction equation values over time at 1m of groundwater level and 20% initial water content are shown in Figure 4 below.
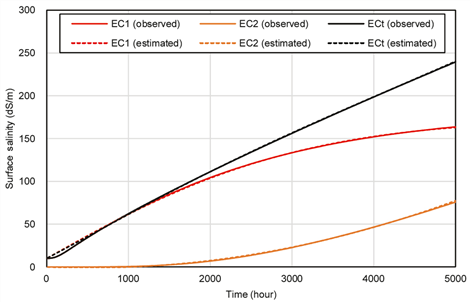
As shown in Figure 4, it is possible to easily predict the surface salinity of the reclaimed land after a certain time, by substituting the initial salinity of the surface layer and the salinity of the groundwater to equation (5).
The prediction equation in this study is based on the default library of the CHEMFLO model targeting Silt Loam. In the actual field, the engineering classification, the hydraulic properties of the soil are different depending on various factors such as the composition of the soil layer, compaction, particle size distribution, and organic matter content. It is necessary to establish a salinization prediction equation according to changes in various soil characteristics such as the factors of the SWCC, organic matter content, and density. Consequently, the prediction accuracy can be improved by securing soil properties databases of object field. In addition, the water content profile used in this study was fixed condition after capillary rising time. So it does not take into account the sudden change in the water content profile, by rainfall or drainage. Therefore, it is necessary to develop the predicting method for the surface salinity in consideration of classifying the water content profile, by the season and climate events. In the future, if the changes of water contents by rainfall and evaporation can be considered, it is expected that the prediction equation can be corrected through field monitoring data, and the reliability of the predictive equation can be strengthened through soil column test.
Ⅳ. Summary & Conclusion
In this study, a prediction equation was developed for the surface salinity of the reclaimed land, according to various surface water content and groundwater level, based on the simulation results of the CHEMFLO model. A summary of the results is as follows.
In order to simulate the water content profile of the reclaimed land, the capillary rising time were calculated, for each initial surface water content and groundwater level conditions. A regression equation was derived based on the calculation results. It was found that this regression equation has simplicity in shape and shows a high coefficient of determination of 0.9955, which predicts the simulation results well.
The surface salinity prediction equation was developed based on the CHEMFLO simulation for each cases on various initial water content and groundwater levels. The form of each equation is composed of a combination of a simple polynomial and exponential function, and the two terms constituting the prediction equation represent a rising of salinity in soil, and in groundwater. They showed the coefficients of determination of 0.9816 and 0.9824, respectively, and were found to explain the simulation results well.
The prediction model presented in this study makes it possible to easily predict the surface salinity after a certain time using the initial salinity of the reclaimed land surface and the groundwater. For more accurate prediction, a database on the properties of the soil in the field is secured, and coefficients and exponents of the model can be determined based on this. As a future study, it is necessary to develop a method for predicting surface salinity in consideration of changes in water content profile and leaching according to seasonal and climate events. In addition, to take into account horizontal infiltration and diffusion, it is considered that improvement using appropriate two or three-dimensional models is necessary.