

Ⅰ. Introduction
In response to climate change and carbon reduction commitments, carbon neutrality (net-zero) has become a central objective of national energy and land-use policies. Carbon neutrality refers to achieving a balance between anthropogenic greenhouse gas (GHG) emissions and their removal through absorption or offset mechanisms, resulting in net-zero emissions. Achieving this goal requires a substantial transition toward renewable energy sources with low or zero carbon emissions.
Among available renewable energy options, solar energy is recognized as having the highest potential among renewable energy sources, and efforts to expand solar power generation are underway(Ministry of Trade, Industry and Energy, 2022). In recent years, solar power has accounted for the largest share of newly installed renewable energy capacity in South Korea. As of 2025, the country’s cumulative solar capacity reached approximately 30 GW, with an annual installation of around 3.88 GW (Korea Energy Agency, 2024). According to DNV (2023), solar power is projected to become the most cost- competitive renewable energy source by mid-century, reinforcing its importance in long-term carbon reduction strategies.
Despite these advantages, the expansion of solar photovoltaic (SPV) systems presents significant land-use challenges. Due to limited available space in densely built-up urban areas, solar power development has been concentrated primarily in rural regions. As a result, solar installations increasingly compete with agricultural land, forested areas, and rural landscapes. Previous studies have shown that a large proportion of commercial solar facilities are small-scale installations located in rural areas, where land availability is relatively higher (Lee et al., 2018). However, the cumulative impact of these installations has raised concerns regarding farmland reduction, forest disturbance, and landscape degradation (Yang et al., 2017).
Landscape change associated with solar power development has been identified as an important factor influencing rural sustainability. Mérida-Rodriguez et al. (2015) emphasized the need for landscape-sensitive planning tools in regions experiencing rapid photovoltaic expansion. Empirical studies have shown that solar facilities can negatively affect perceptions of rural landscapes and local amenity values, with potential implications for rural tourism and residential attractiveness (Lee, 2023; Kim et al., 2021). These findings suggest that renewable energy expansion in rural areas should be evaluated not only from an energy and environmental perspective but also in relation to social and economic dynamics.
Accordingly, a comprehensive and multidimensional assessment framework is required to evaluate the regional impacts of solar power deployment. Such an assessment should consider population dynamics, economic activity, land-use change, and environmental outcomes simultaneously, rather than addressing these factors in isolation.
System dynamics provides an effective methodological framework for this purpose. As a policy-oriented modeling approach, system dynamics focuses on feedback structures, non-linear interactions, and time-dependent behavior within complex systems (Turner et al., 2016). It has been widely applied in spatial planning and resource management fields, including environmental management, urban growth control, transportation systems, and energy environment interactions (Fong et al., 2009; Wang et al., 2008; Stave, 2003). In particular, system dynamics models have been used to analyze the interrelationships among population change, economic activity, energy consumption, and carbon emissions at regional scales (Gu et al., 2020; Wu and Ning, 2018). Domestic studies have also applied system dynamics to evaluate the spillover effects of spatial and regional policies, including balanced regional development, urban growth management, and major national infrastructure decisions (Kim and Jo, 2006; Moon, 2002; Lee et al., 2005).
This study is predicated on the extant body of research and aims to examine the population, economic, and environmental impacts of solar power deployment in rural areas from a regional perspective. To achieve this objective, a regional system dynamics model is developed integrating landuse change, energy production, population dynamics, and carbon emissions. A comparative analysis of solar power deployment scenarios is conducted, encompassing farmland-based solar installations, agrophotovoltaic (agroPV) systems, and mountainous-area installations. The results of this study offer insights into the trade-offs between renewable energy expansion and rural sustainability. These findings have implications for the management of agricultural land and the planning of rural energy initiatives.
Ⅱ. Material and Methods
1. Study Area and Data
This study focuses on Jeollanam Province in South Korea as the target region. Solar energy is the largest source of renewable energy production in South Korea, accounting for 42.1%, as of 2022 (Korea Energy Agency, 2023). Jeollanam Province is particularly active in solar power deployment, with solar power generation accounting for 77.74% of renewable energy production in the region and representing 20.64% of the national solar power production (Fig. 1a). This prominence is attributed to Jeollanam Province’s exceptional solar potential, surpassing that of all other provinces in South Korea. Fig. 1b shows a map of South Korea’s solar potential (Korea Institute of Energy Research, 2023), with the highlighted region corresponding to the study area, Jeollanam Province.
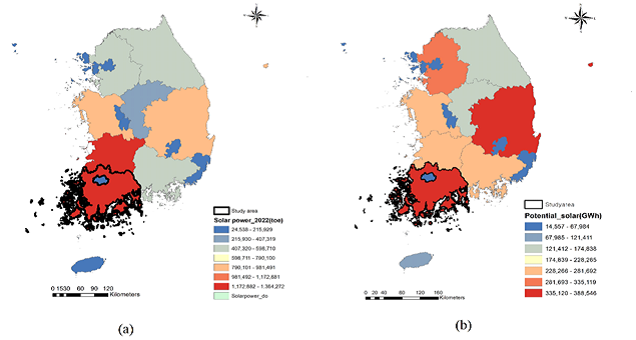
Fig. 1
Current solar power generation and potential in South Korea: (a) solar power generation in 2022 and (b) provincial solar power potential
Data for model calibration and parameter estimation were obtained from the Korean Statistical Information Service (KOSIS) (Statistics Korea, 2023) covering the period from 2016 to 2020. Model parameters representing average annual rates (birth rate, death rate, migration rates, income per unit area, land-use change rates, etc.) were calculated as five-year averages from the 2016-2020 time-series data. Initial values for stock variables (population, farmland area, number of businesses, etc.) were derived from 2016 cross-sectional data.
The SD model in this study comprises the population and households sector, the industry sector, and the land use sector. The economic, energy, and environmental impacts in each sector were calculated using the following data.
For the population and household sector, data were sourced from the Population Census and Administrative Statistics (Statistics Korea, 2023), including registered population, birth rate, death rate, in-migration rate, and out-migration rate. Additionally, household-level energy consumption data were obtained from the Korea Energy Economics Institute (2023), while vehicle registration data were obtained from Statistics Korea (2023).
For the agricultural part of the industry sector, we used the number of agricultural households and the population of farmers from the Agricultural, Forestry, and Fisheries Census (Statistics Korea, 2023), and the area of agricultural land from the Agricultural Land Survey (Statistics Korea, 2023). For the service industry, we used data on the number of businesses and employees from the Nationwide Business Establishment Survey (Statistics Korea, 2023).
In the economic domain, regional income was derived from the Gross Regional Domestic Product (GRDP) by economic activity. For energy consumption, Energy consumption data were obtained from the Energy Consumption Survey (Statistics Korea, 2023) and regional energy consumption from the Regional Energy Statistics Yearbook (Korea Energy Economics Institute, 2022), and automobile energy consumption from the Automobile Energy Consumption Efficiency Analysis (Korea Energy Agency, 2022). These data were used to estimate energy consumption in households, automobiles, industry, and agriculture.
Regarding solar power generation, data from the Renewable Energy Supply Achievement Survey (New and Renewable Energy Center, 2023) and solar electricity sales data (Korea Power Exchange, 2023) were utilized. Data on carbon emissions were obtained from the Ministry of Environment’s 2022 Regional Greenhouse Gas Inventory (Ministry of Environment, 2023).
2. Urban Dynamics Model
This study is conducted based on an urban dynamics model using system dynamics. Urban dynamics refers to the study of how cities evolve and change over time. It analyzes the dynamics of the urban life cycle. Jay W. Forrester, in his influential book titled “Urban Dynamics (Forrester, 1970)”, introduced a computer simulation model that captures how cities grow, stagnate, or decline. By simulating the life cycle of a city, Forrester’s work predicts the impact of proposed remedies on the urban system (Diemer and Nedelciu, 2020).
Alfeld and Graham (1976) proposed the concept of the attractiveness of the city as a pivotal factor in the process of urban growth and decline. Urban attractiveness encompasses not only aesthetic appeal like beautiful scenery but also the social and economic magnetism that draws individuals from surrounding areas and sustains population influx across socioeconomic strata. Urban congestion and environmental pollution undergo cyclical processes that diminish urban attractiveness, resulting in decreased population inflow and eventual stagnation. This concept of city attractiveness serves as a valuable framework within the context of regional system analysis.
In this study, the regional system dynamics model was developed by adapting an urban dynamics model, and the STELLA software was utilized for model design, implementation, and scenario simulation. The attractiveness of a region is evaluated based on factors such as regional vitality and landscape appeal, referring to the job multiplier attractiveness of the urban dynamics model.
Ⅲ. System Dynamics Model Design
This study develops a system dynamics (SD) model based on the urban dynamics framework to examine the social, economic, and environmental impacts of introducing solar power generation in rural areas. Social changes are represented by population dynamics, economic effects are measured through regional income expressed as gross regional domestic product (GRDP), and environmental impacts are evaluated using net carbon emissions. Although the model adopts an urban dynamics structure, detailed representations are provided only for the agricultural and service sectors due to limited information on the industrial sector.
1. Overview of the Model Structure
The SD model consists of three interconnected sectors: the population and household sector, the industry sector, and the land-use sector (Fig. 2). The population and household sector captures population change and household-related dynamics. The industry sector includes primary industries represented by farmland-based agriculture and tertiary industries represented by service businesses. The land-use sector distinguishes among farmland, forest areas, and solar power generation sites.
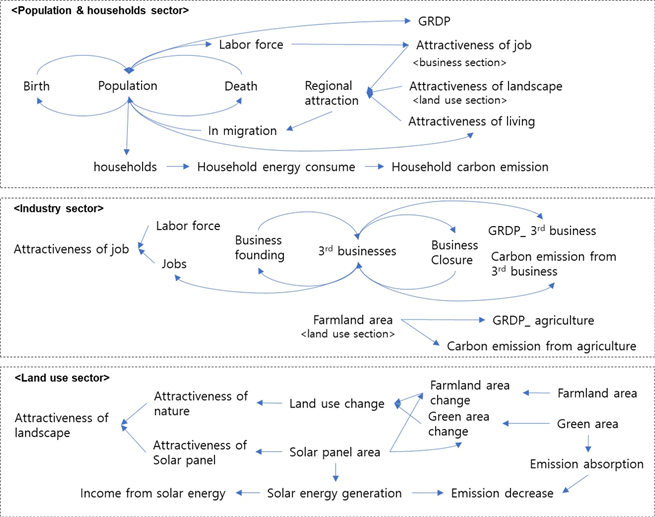
The model focuses on three key outcome variables: population, regional income (GRDP), and net carbon emissions. Interactions among sectors are mediated through attractiveness variables, which link demographic changes to economic and land-use conditions within the system. Both stock and flow variables are used across all sectors, while nonlinear relationships are represented using graphical (table) functions. Model parameters are based on a combination of empirical statistics, literature-informed assumptions, and scenario settings. All attractiveness-related variables represent structural proxy indices derived from land-use composition rather than direct perceptual measurements. These indices are employed to simulate feedback dynamics and system responses within the regional modeling framework.
2. Population Dynamics and Regional Attractiveness
Population change in the model is driven by regional attractiveness, which influences migration flows. Regional attractiveness is defined as a composite index consisting of employment attractiveness, regional vitality, and landscape attractiveness, as expressed in Eq. (1).
Landscape attractiveness is modeled as a function of land-use conditions, including the preservation of farmland and forest areas and the extent of solar power installation. In this study, landscape attractiveness is conceptualized as a structural proxy index derived from land-use composition rather than direct perceptual measurement. It represents potential scenic quality associated with landscape structure, not observed human preference. This approach follows landscape assessment frameworks in which land-use composition and infrastructure presence are used as indicators of scenic and visual landscape character. To capture nonlinear responses under substantial land transformation, the model introduces a 30% change level as a scenario parameter representing intensive land-use alteration. This value does not indicate an empirically established perception threshold but functions as a modeling assumption to explore system sensitivity to large-scale visual and structural landscape change.
Through this structure, solar power deployment is represented as influencing population dynamics within the modeled system by altering landscape conditions and, consequently, the regional attractiveness index.
3. Regional Income (GRDP) Module
Regional income in the model is calculated as the sum of income generated from agriculture, service industries, solar power generation, and exogenous income sources outside the regional production system, as shown in Eq. (2).
Agricultural income is assumed to be proportional to the area of available farmland, reflecting land-based production characteristics. Income from the service sector is modeled as proportional to the number of service businesses, which is influenced by population size and regional vitality. Income from solar power generation is calculated based on the total electricity produced by installed solar panels, under the assumption that all generated electricity is sold to the grid at a fixed unit price. Costs related to solar panel installation, operation, and maintenance are not explicitly considered in this module. Income from solar power generation in this model represents gross production value rather than net regional economic benefit. Installation costs, maintenance expenses, grid constraints, and ownership structures are not included. Therefore, GRDP results should be interpreted as relative scenario comparisons within the modeling framework rather than as projections of actual regional economic gains.
This formulation allows the model to capture the contribution of solar power generation to regional income while maintaining consistency across scenarios.
4. Carbon Emission Module
Carbon emissions in the model consist of three components: emissions from energy consumption, carbon sequestration by forests and green spaces, and emission reductions resulting from renewable energy generation, particularly solar power, as described in Eq. (3).
Energy-related carbon emissions are calculated for the residential, transportation, and industrial sectors based on emissions per household and per unit area of land use. Carbon sequestration is represented as a function of forest and green space areas, reflecting their role as carbon sinks. Emission reductions from solar power generation are estimated by converting electricity production into avoided carbon emissions using an emission factor.
By integrating these components, the model evaluates net carbon emissions at the regional level and enables comparison of environmental outcomes across different solar power deployment scenarios.
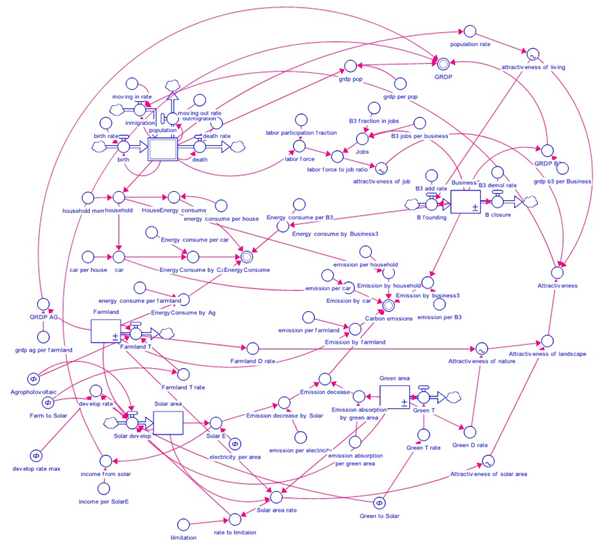
Based on the above structure and assumptions, the SD model was implemented using STELLA software to simulate the long-term impacts of solar power generation on population, economic activity, and carbon emissions in rural areas (Fig. 3).
Ⅳ. Scenario-based Simulation Results and Discussion
1. Scenarios
Three scenarios were developed to evaluate alternative strategies for solar power deployment in rural areas and to examine their population, economic, and environmental impacts at the regional level. In addition to these scenarios, two reference models were included: a baseline model representing the current trend of solar power expansion and a comparison model in which solar power generation is not introduced.
The baseline model assumes that the recent rapid expansion of solar power generation area (31.512% annually) cannot continue indefinitely. To avoid unrealistic extrapolation, solar expansion is constrained using a logistic growth function with an upper limit of 20% of the total farmland and mountainous areas. In this model, the direct impacts of solar panel installation on farmland and mountainous land areas are not explicitly considered due to uncertainty in land-use conversion processes. Accordingly, the baseline model serves as a reference trajectory for comparison purposes rather than as a realistic policy scenario.
The first scenario considers the installation of solar panels on farmland, with either 0.5% or 1% of the total farmland area converted annually into solar power generation sites. This scenario represents a gradual transformation of farmland into dedicated energy production areas.
The second scenario introduces agroPV systems on farmland, allocating either 0.5% or 1% of the farmland area annually. Agrophotovoltaics combines agricultural production and photovoltaic power generation by installing solar panels above crop fields (Ferrara et al., 2023; Weselek et al., 2019). While this scenario assumes a reduction in agricultural productivity due to shading effects, the total farmland area is preserved.
The third scenario involves the installation of solar power facilities in mountainous areas, with 0.25% of the mountainous area designated annually for solar panel installation. This results in a proportional reduction in mountainous land area over time.
Table 1 summarizes the key variables modified under each scenario and provides a quantitative overview of land-use change and solar power deployment assumptions.
Table 1
Parameters and description of three scenarios
2. Simulation results
The proposed solar power deployment scenarios were implemented using the system dynamics model and compared with a comparison model without solar power generation and a baseline model representing current solar power expansion trends. The simulation results were evaluated in terms of population change, economic performance, and net carbon emissions over a 20-year period. A summary of the simulation outcomes is presented in Table 2.
Table 2
Simulation results for population, GRDP, and carbon emissions over the 20-year simulation period
2.1. Overall comparison of scenarios
Compared with the comparison model (Run 1), the baseline model (Run 2) shows a substantial increase in GRDP and a significant reduction in net carbon emissions, reflecting large-scale solar power expansion. However, direct comparison between the baseline model and alternative scenarios is not appropriate for population, GRDP, or carbon emissions. The baseline model does not incorporate negative feedbacks from land-use conversion (farmland/forest loss, landscape degradation), which are explicitly modeled in Scenarios 1-3. Therefore, the baseline model should be interpreted as a reference trajectory rather than a competing policy option.
Among the alternative scenarios, farmland-based solar installations (Scenario 1 and Scenario 1-1) yield the largest economic gains and carbon emission reductions, but they are also associated with the most pronounced population decline. Solar power deployment in mountainous areas (Scenario 3) produces moderate economic and environmental benefits accompanied by a relatively large population decrease. In contrast, agroPV scenarios (Scenario 2 and Scenario 2-1) result in smaller population declines while achieving moderate economic growth and carbon emission reductions.
2.2. Population change
Simulation results indicate a declining population trend across all scenarios over time (Fig. 4a), although the magnitude of decline varies by solar power deployment strategy. Farmland-based solar installations (Scenario 1 and Scenario 1-1; corresponding to Run 3 and Run 4) exhibit the largest population decreases, reflecting reductions in regional attractiveness associated with farmland conversion (Fig. 4b).
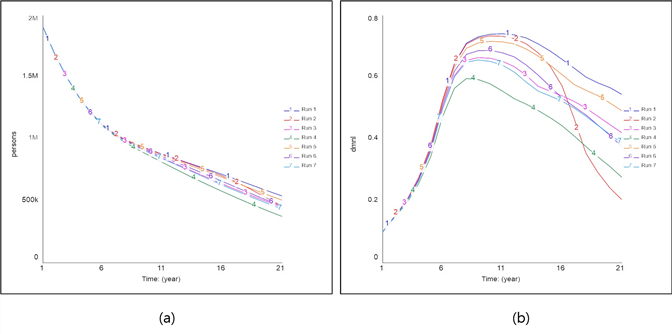
Fig. 4
Simulation results for population dynamics: (a) population change and (b) attractiveness under each scenario
In contrast, the agroPV scenario with 0.5% annual farmland installation (Scenario 2; Run 5) shows the smallest population decline among all solar power scenarios. Although population levels remain lower than those in the comparison model without solar power generation (Run 1), they are higher than those observed under large-scale farmland-based or mountainous-area solar installations. This result suggests that combining solar power generation with continued agricultural land use mitigates population decline.
2.3. Economic impacts
GRDP increases in all solar power deployment scenarios compared with the comparison model (Fig. 5a). Despite overall population decline, economic growth is driven by income generated from solar power production (Fig. 5b). The baseline model (Run 2) records the highest GRDP, reflecting the assumption that solar expansion does not reduce farmland area or agricultural output.
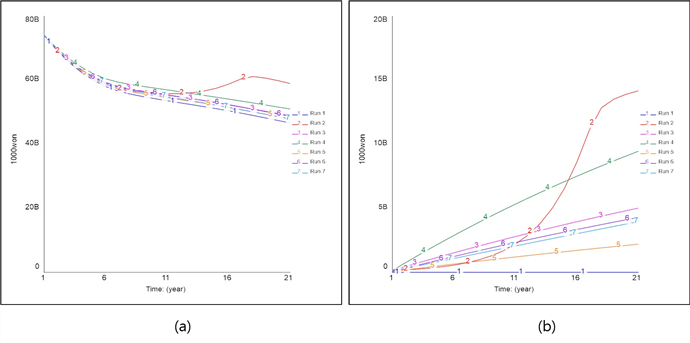
Fig. 5
Simulation results for regional economic impacts: (a) changes in GRDP and (b) income from solar power generation under each scenario
Among the alternative scenarios, annual installation of solar panels on 1% of farmland (Scenario 1-1; Run 4) generates the highest solar power income. Scenarios involving smaller-scale farmland installations (Scenario 1; Run 3) and agroPV systems with 1% annual installation (Scenario 2-1; Run 6) exhibit similar GRDP levels. This pattern suggests that reductions in agricultural production and population partially offset income gains from solar power generation.
2.4. Carbon emissions
Net carbon emissions decline under all solar power deployment scenarios (Fig. 6a). The baseline model (Run 2) achieves the greatest overall emission reduction during the simulation period, followed by the farmland-based solar scenario with 1% annual installation (Scenario 1-1; Run 4). Although the baseline model incorporates a logistic growth function that constrains solar area expansion over time, net carbon emissions continue to decrease steadily throughout the simulation horizon.
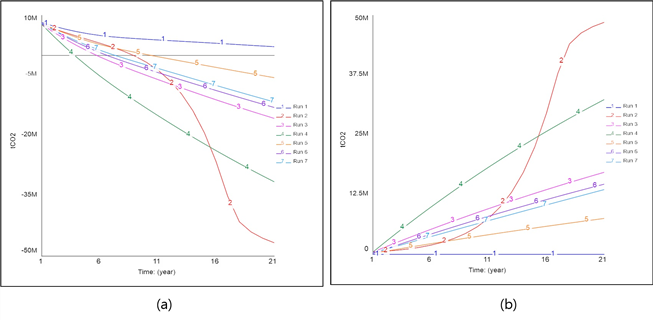
Fig. 6
Simulation results for environmental impacts: (a) regional net carbon emissions and (b) emission reductions under each scenario
Emission reduction patterns are further illustrated in Fig. 6b, which presents cumulative carbon emission reductions attributable to solar power generation. During the first approximately 16 years, Scenario 1-1 shows greater emission reductions than the baseline model, reflecting its constant rate of solar expansion.
3. Discussion
The simulation results indicate that the expansion of solar power generation provides substantial environmental benefits through carbon emission reduction, while also generating positive economic effects via additional regional income. At the same time, the scenario results suggest that, under the assumed model structure, large-scale solar deployment is associated with reductions in the landscape attractiveness index and corresponding population decline.
Across the scenarios, a clear trade-off emerges between environmental performance and social sustainability. Scenarios with higher rates of solar power expansion achieve greater emission reductions and economic gains, but are accompanied by more pronounced population decreases. This suggests that an energy-focused development strategy may gradually transform rural regions into energy production spaces rather than multifunctional living spaces.
In contrast, the agroPV scenario with a moderate expansion rate (0.5% of farmland annually) demonstrates a comparatively balanced outcome. While its environmental and economic effects are smaller than those of large-scale solar deployment, this scenario exhibits the least population decline among the alternatives. By allowing continued agricultural activity alongside energy production, agrophotovoltaics mitigate negative landscape and land-use impacts that influence regional attractiveness.
These findings indicate that, within the modeled scenarios, strategies that integrate agricultural land use with solar generation may produce more balanced social and environmental outcomes. The results should be understood as exploratory insights derived from a system dynamics framework rather than prescriptive planning thresholds.
The interpretation of these results depends on several structural assumptions embedded in the system dynamics model, including simplified land-use change processes and aggregated regional behavior. These assumptions and the resulting limitations are discussed in the following section.
4. Model Assumptions and Limitations
To appropriately interpret the simulation results and discussion presented above, this subsection summarizes the key modeling assumptions and limitations.
4.1. Assumptions
This study uses a system dynamics model to evaluate the long-term regional impacts of solar power deployment in rural areas. To ensure model simplicity and comparability across scenarios, several assumptions were adopted.
First, all electricity generated by solar power systems is assumed to be sold to the grid at a constant unit price. Operation and maintenance costs, grid constraints, and market price fluctuations are not explicitly considered, which may lead to an overestimation of economic benefits but allows consistent comparison among scenarios.
Second, in agroPV scenarios, agricultural production is assumed to be reduced to 80% of the original level due to shading effects, based on previous empirical studies (Kim et al., 2021; Weselek et al., 2019).
Third, land-use changes are assumed to occur at constant annual rates defined by each scenario. Policy delays, local opposition, and technological changes are not explicitly modeled. The baseline scenario assumes a logistic growth pattern for solar area expansion with an upper limit.
Fourth, population migration is influenced by regional attractiveness, represented as a composite index of employment, regional vitality, and landscape conditions. Landscape attractiveness is simplified as a function of changes in farmland, forest area, and solar installation area.
Finally, the model assumes a sufficient housing supply and does not explicitly consider housing market dynamics or infrastructure capacity constraints.
4.2. Limitations
Several limitations should be considered when interpreting the results.
First, the model analyzes aggregated regional dynamics and does not capture spatial heterogeneity within the study area, such as differences among municipalities.
Second, detailed economic cost structures—including installation costs, maintenance costs, and subsidy schemes—are not included. Moreover, solar facilities in rural areas are often owned by external investors, which limits the extent to which revenue translates into local economic benefits. Accordingly, GRDP outcomes may overestimate net regional economic value and are better interpreted in terms of relative differences across scenarios.
Third, environmental impacts are evaluated mainly through carbon emissions and sequestration, while other ecological effects, such as biodiversity loss or soil degradation, are not explicitly addressed.
Fourth, population dynamics are based on historical trends and attractiveness-driven migration functions. The numerical parameters used in the attractiveness function, including the 30% land-use change level, are modeling assumptions introduced for scenario exploration and have not been empirically validated as perception thresholds.
Despite these limitations, the model provides a consistent framework for comparing alternative solar power deployment strategies and for examining trade-offs between renewable energy expansion and rural sustainability.
4.3. Future Research Directions
Future research could directly address the limitations identified above through several extensions. Spatial disaggregation to the municipality level would capture local variations in solar potential, landscape sensitivity, and demographic patterns currently masked by regional aggregation. Incorporating detailed cost structures—including installation expenses, operation and maintenance costs, and subsidy schemes—would provide more realistic economic assessments, particularly given the limited local revenue retention when facilities are externally owned. Expanding environmental evaluation beyond carbon accounting to include biodiversity impacts, soil degradation, and ecosystem services would enable more comprehensive sustainability assessment. Integrating scenario analysis for external shocks such as policy changes or economic crises would improve applicability for long-term planning under uncertainty. Finally, empirical validation using data from regions with varying solar deployment levels would strengthen the landscape-migration relationship and enable refinement of threshold parameters.
Ⅴ. Conclusions
This study investigated the multidimensional impacts of rural solar power expansion on population, economy, and the environment using an extended system dynamics model. The simulation results indicate a potential trade-off between renewable energy expansion and rural sustainability within the modeled system. While aggressive solar expansion (Scenario 1-1) is associated with a 9.3% increase in GRDP and substantial carbon reduction, the scenario is also associated with a 31% greater population decline in the model, reflecting the influence of reduced landscape attractiveness within the assumed feedback structure. In contrast, agroPV systems (Scenario 2-1) demonstrate a more balanced trajectory in the simulations, limiting modeled population loss to 15.4% while maintaining economic growth and carbon reduction.
Consequently, the results suggest that agroPV scenarios demonstrate comparatively balanced outcomes within the modeling framework. These findings highlight the potential advantages of integrating solar energy with agricultural land use and provide an exploratory modeling perspective relevant to discussions surrounding the emerging legal framework for agroPV. Although this model relies on simplified assumptions and regional aggregation, it offers a novel system dynamics–based framework that conceptually integrates social and environmental feedback processes. Future research should incorporate spatial heterogeneity and detailed socio-economic factors to further refine the assessment of renewable energy policies in diverse rural contexts.