

Ⅰ. INTRODUCTION
The hydraulic ram pump (HRP) uses the water hammer effect to deliver a small portion of water to a much greater height using the energy from a large amount of water flowing down from a small height. In general, only about 2 to 20% of the water is delivered to higher storages depending on system configurations. The rest is discharged into the downstream near to the pump. Therefore, the HRP can be defined as a hydraulic machine to pump less amount of water using the potential energy of larger amount of water discharged from an insignificant height based on the transient changes in pressure. The performance of a HRP is related with the natural topography and the available water supply that determine the operation parameters. The HRP has only two moving parts of check valves, making it relatively inexpensive and easy to construct. And it is environmentally friendly since it uses a renewable potential energy of water source. Based on previous studies and reports, Carvalho et al. (2011) summarized guidelines and performances of HRP with respect to major parameters such as the minimum drive height, the ratio of delivery heights over drive heights, ratio of delivery flow over the drive flow and the efficiencies.
The HRP dates back to an original design introduced in late 1700’s (USDA, 2007). According to Young (2016), the first HRP was able to deliver water to a height of 4.9 m with manual operation of opening and closing the stopcock. Later the HRP was upgraded into automatic ones. Wide interest in HRP continued during the 19th century and a number of patents were issued in the United States and European countries. The interest in HRP decreased in late 19th century with the growing availability of electricity and electrical pumps. The HRP has been in use for over 200 years since its introduction for pumping surface water to considerable heights particularly in regions where power grid is not accessible.
One of the major factors determining the function of the HRP is the velocity in the drive pipe which is directly related to closing the waste valve (Lansford and Dugan, 1941). The cycle of opening and closing valves is an important factor related to the performance of the HRP. In his comprehensive investigation on the HRP performances, Iversen (1975) listed the drive head and flow, the discharge head and flow, the cycle frequency as key operation parameters affecting HRP efficiencies. Maratos (2003) reported that HRP could be used to create the pressure required for reverse osmosis of seawater and made a conclusion that the HRP was both economically and technically feasible for the application. This application is slightly different from others in that the HRP was used to generate pressure rather than to pump water. Modified HRPs were also introduced to improve their performance and efficiencies. Sampath et al. (2015) investigated the changes in the power and efficiency of a redesigned HRP by eliminating the exhaust water effect at the check valve. They tried to see the potential applications of HRP for power generation. Yang et al. (2014) also proposed a novel design that replaced a traditional inlet diffuser by a short cambered one in order to improve the efficiency of the pump. Mathematical and numerical studies were also conducted to analyze unsteady flow and working cycles in the HRP (Carvalho et al., 2011).
One of the main components in fabricating HRPs is the air chamber which holds pressure and discharge water. The chamber should be made of rigid materials to minimize the pressure losses. The energy impulse into the air chamber at the forceful opening of the check valve is stored up in the form of elastic energy by the air which is subsequently used to maintain a continuous outflow of water through the delivery pipe.
Still most installations of HRP are based on rules of thumbs and arbitrary assumptions in their designs in many developing countries. The HRP can be fabricated with easily available materials such as PVC pipes and plumbing parts which are purchased from local markets. However, few studies suggested appropriate volume of air chamber in HRP fabrications. This study aims to investigate the effects of the size of PVC air chamber on HRP performance when it was assembled with commercially available plumbing parts. The results of this study would help provide information for the installation of affordable HRP in rural areas in many developing countries.
Ⅱ. FUNCTIONING PRINCIPLES
Initially, water flows from the drive storage down the drive pipe to HRP (Fig. 1). The swing check valve (1 in Fig. 2) in the pump is open and allows water to flow away. This water is called waste water or spill water, which is discharged into streams near or lower than the HRP. The valve is also called the waste valve. As the flow continues and water flow increases, the swing check valve closes instantly which remained open by gravity unless the flow was large enough. This quick closing creates a sudden high pressure, which is well known as water hammer. The pressure transfers to another check valve (2 in Fig. 2) and the valve opens for water to flow into air chamber. The pressure inside the air chamber increases before the ball valve (5 in Fig. 2) opens to release water to the delivery storage. As the pressure rapidly decreases, the check valve 2 closes. The waste valve (check valve 1) opens and the cycle starts again. In Fig. 2, dotted lines indicate the one-way flow directions of check valves. A large portion of water from drive storage flows down as waste or spill water through the waste valve. Only a small amount of water flows up to the delivery storage by the water hammer.
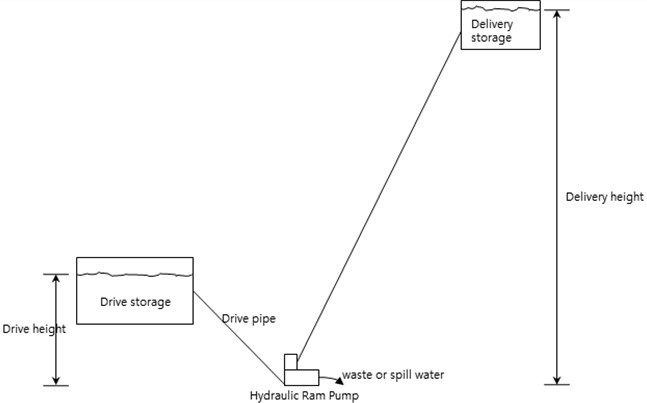
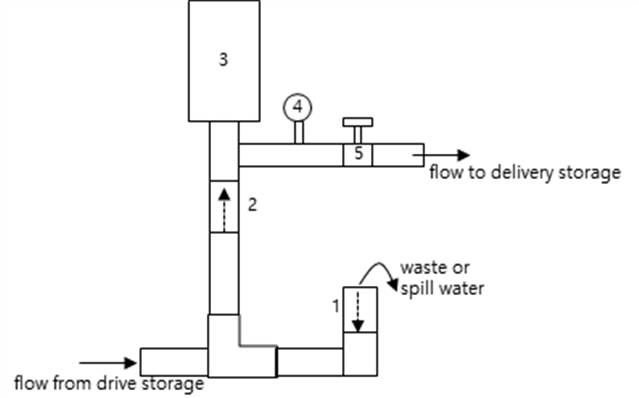
Fig. 2
Components of hydraulic ram pump (1: waste check valve; 2: check valve, 3: air chamber, 4: Pressure gauge, 5: delivery valve)
Inside the air chamber the pressure is nearly constant and flow rate to the delivery storage is also near constant. Meanwhile, the flow from the waste valve is intermittent by the movement of disc or ball supported by spring in the valve.
Ⅲ. METHODOLOGY
1. Hydraulic ram pump
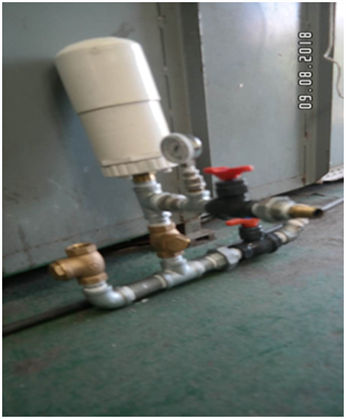
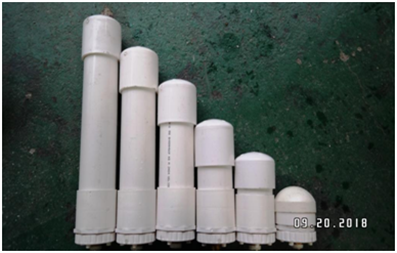
The HRP for the experiment was assembled with 1" PVC pipes and joints, and swing check valves of cast iron as shown in Fig. 2. It should be noted that the flow direction of waste valve (1) is towards the pipe and that of delivery valve towards the air chamber. The plastic tank of a capacity of 50 L was used for the drive tank. It was connected to the HRP with the drive pipe (Fig. 1). PVC ball valves were also included before and after the HRP to control its operation. A pressure gauge was also installed to measure pressure immediately after the air chamber. Fig. 3 shows the assembled HRP. The air chamber was made of 4" PVC tubes, caps, and sockets with plumbing glue. Six different air chambers were prepared to have the volume of 1, 2, 3, 4, 5, and 6 L, respectively (Fig. 4).
Two cumulative flow meters were installed for measuring flow rates. One was installed between the drive tank and the HRP for measuring the total flow rate from the drive tank. The second flow meter was placed immediately after the air chamber to measure delivery or lift flow. The waste flow was calculated by the difference between the total and delivery flow.
2. Experimental conditions
The drive heights (H) for the experiment were 1.7m and 2.35m while three different delivery heights (h) were set for the experiment as shown in Table 1. The experimental conditions including pipe length are summarized in Table 1.
Table 1
Experimental conditions
| Air Chambers volume (L) | 1 through 6 |
| Fall height (H) | 1,7 m, 2.35 m |
| Supply or delivery height (h) | 4.5 m, 6 m, 7.5 m |
| Reservoir | 50 ± 2 L |
| Drive pipe length | 2 m and 2.9 m |
| Delivery pipe length | 10 m |
When the waste valve starts the cycle of opening and closing, the time was recorded using an electronic stop watch. Video clips were also captured to record both time laps of the stop watch and the sound of the waste valve operation. The video clips were used to acquire the cycle frequency of waste valve operation. The cycle frequencies were compared for pressure building phase and the pumping phase of the experiment.
Two different efficiencies were calculated and compared for the experimental results, the power efficiency and the water delivery efficiency. The power efficiency, Ep was calculated as output power of the HRP divided by the power input of water flow from drive tank,
where Q is delivery flow rate, h is delivery height, Qd is drive flow rate, H is drive height. Another efficiency, the pumping efficiency, Ew was calculated as the ratio of delivery to the drive volume of water.
where Vp is pumped or delivery volume of water and Vd is drive volume of water.
Ⅳ. RESULTS AND DISCUSSIONS
1. Pressure and flow rate
The air chamber is under the initial atmospheric pressure until the waste valve is closed. The waste valve is closed only when the flow rate is greater than a certain threshold below which disc or ball in the check valve is open. The pressure is developed by the first stroke of the closure of the waste valve. If this pressure was not large enough to cause the complete cycle, the HRP did not start working.
Table 2
Maximum pressure observed under different drive heights (mbar)
| Air chamber volumes (L) | Max. pressures for different drive heights | |
| 1.7 m | 2.35 m | |
| 1 | 699.7 | 1074.0 |
| 2 | 689.7 | 1054.7 |
| 3 | 681.3 | 1054.3 |
| 4 | 676.3 | 1057.0 |
| 5 | 676.0 | 1023.0 |
| 6 | 684.3 | 1025.3 |
Only HRP with the 1L of air chamber demonstrated this operation capability without priming for both drive heights of 1.7 and 2.35 m. The larger air chamber volume HRPs needed to be primed to reach the operational pressure. The priming requirement for normal operation, in terms of the number of valve operation cycle, increased with the volume of the air chamber. This indicates that the larger volume of the air chamber requires more valve operation cycles in order to attain enough pressure.
It took about 1 minute to reach the maximum pressure under the delivery valve closed. During this time, the waste valve continued the cycle of opening and closing to release water and the pressure in the air chamber increased to the maximum pressure. The maximum pressure developed in the air chamber was about the same irrespective of the volume. Under this pressurizing phase, water is forced to flow into the air chamber by water hammer effect induced by the instant closing of waste valve. This is the stage to build up the pressure that will be required to maintain a constant and stable pumping of the water when the delivery valve is opened.
The maximum pressures obtained from the pump increased with the drive height. When the drive height was 1.7 m, average value of maximum pressures was 684.6 mbar. When the drive height increased to 2.35 m the maximum pressure was also increased to average of 1048.1 mbar. It could be observed that the maximum pressure developed in the air chamber is about the same irrespective of the volume.
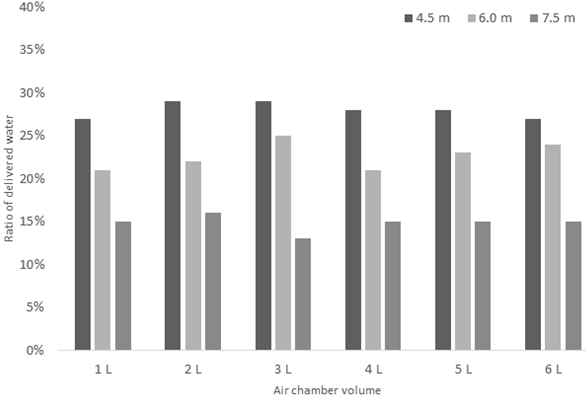
When the drive height was fixed, the ratio of waste discharge over the total discharge from the drive tank did not show substantial difference among the volumes of air chamber as shown in Table 3. For the drive height of 4.5 m, about 72 % of total volume was discharged as waste flow of which the energy was used to lift the rest, 28% of the total flow to the upper tank. As the drive height increased to 7.5m, the ratio of waste discharge reached over 85%. It could be seen that the chamber size did not affect the water volumes pumped. The delivery flow decreased with the delivery height. Fig. 4 clearly shows that the water pumped volumes are irrelevant to the size of chamber size but greatly affected by the delivery height.
Table 3
Comparison of the ratio of waste over total drive flow for different volumes of air chamber (Drive height at 2.35 m)
| Delivery height (m) | Ratio of waste over total flow for different air chamber volumes | |||||
| 1 L | 2 L | 3 L | 4 L | 5 L | 6 L | |
| 4.5 | 73% | 71% | 71% | 72% | 72% | 73% |
| 6 | 79% | 78% | 75% | 79% | 77% | 76% |
| 7.5 | 85% | 84% | 87% | 85% | 85% | 85% |
Flow rates were also similar to the water volume for different drive heights and air chamber volume conditions. Flow rates were not much different for different chamber volume sizes but greatly affected by delivery height. Meanwhile, discharge rates from the drive tank were substantially decreased as the delivery height increased. When the delivery height increased from 4.5 m to 7.5 m, the total discharge rates decreased from about 20 LPM to about 15 LPM (Table 4). The decrease in flow rates by the increase in delivery heights was greater in delivered discharge than in waste discharge. The changes in waste flow rates were relatively smaller compared to the delivered flow rates.
Table 4
Flow rates of delivered and waste discharge for different chamber volume sizes and delivery heights
2. Power efficiency
Experimental results indicated that the power efficiency was not substantially affected by the volume of the air chamber. However, there existed slight increase in the power efficiency as the delivery height was getting higher at the given drive height. When the delivery height was 4.5 m, the power efficiency ranged from 47 % to 50 %, not showing any notable changes in the efficiency among the different volume of the air chamber (Table 5 and Fig. 6). Meanwhile, the drive height increase from 6 to 7.5 m did not show notable changes in power efficiencies for all the air chamber conditions. The power efficiencies for the drive heights of 6 and 7.5 m were about 55 %.
Table 5
Power efficiencies for different volumes of air chamber at drive height of 2.35 m
| Delivery height | Power efficiencies for different volumes of air chamber | |||||
| 1 L | 2 L | 3 L | 4 L | 5 L | 6 L | |
| 4.5 m | 48% | 50% | 49% | 49% | 47% | 48% |
| 6 m | 53% | 55% | 56% | 54% | 54% | 52% |
| 7.5 m | 54% | 56% | 56% | 55% | 54% | 55% |
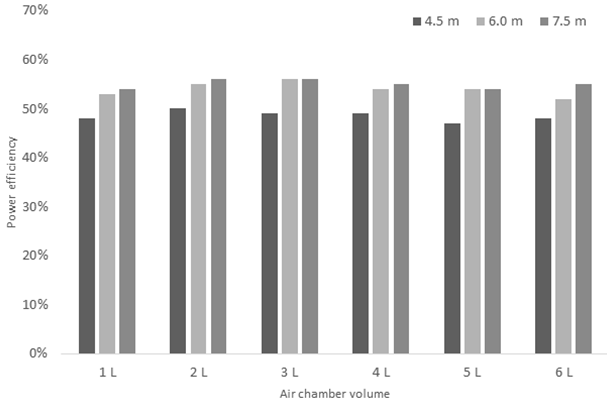
Fig. 6
Power efficiencies for different chamber volumes and delivery height at drive height at 2.35 m
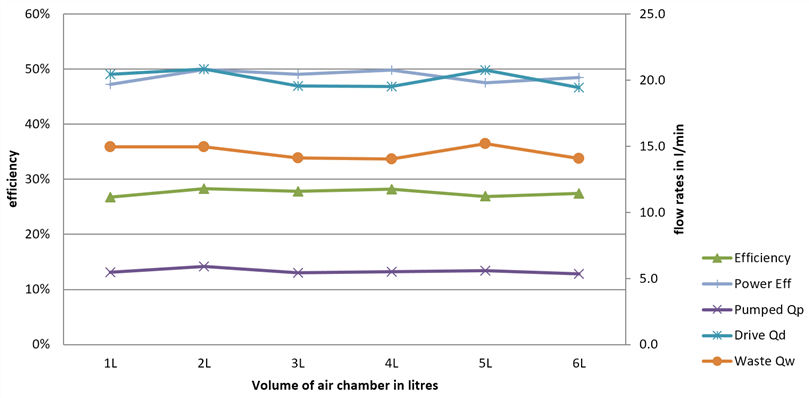
The HRP performances at a given condition of the drive and delivery heights by the different air chamber volumes were summarized in Fig. 6. Both pumping and power efficiencies were rather constant for all the air chamber volume conditions. Not only the efficiencies but flow discharge rates were also near constant. Fig. 6 does not indicate any notable changes or trends in the operation parameters over the different volumes of air chamber.
3. Frequency by waste valve opening
The frequency of waste valve opening was obtained based on the sound by valve opening and closing. The frequency of the waste valve opening changed as the drive height changed. During the HRP operations, the cycle frequency ranged from a maximum of 1.6 to 1.7 Hz as the drive height increased from 1.7 m to 2.35 m. Equally, this increase in the number of cycles was seen also with the increase of delivery height.
The frequencies were near constant of 1.6 Hz during both pressurizing and operation phases for all the volumes under the drive height of 1.7 m. For the drive height of 2.35 m, the pressurizing phase showed a slight increase in the frequency from 1.6 to 1.7 Hz as the volume of the air chamber increased from 1 L to 6 L at the 4 m delivery height. However, the operation phase at the drive height of 2.35 m did not show any significant changes in the frequencies for the different volumes of the air chambers.
Ⅴ. SUMMARY AND CONCLUSION
In spite of its long history of HRPs development and applications, they have been fabricated mostly based on the rule of thumbs in many remote areas of developing countries. This study investigated the effects of the volume of air chamber in HRP on its performances based on a setup of experiments. The HRP was fabricated of commercial pipes and plumbing parts such as check valves available in local markets. The HRP was operated under the given conditions at drive heights of 1.7m and 2.35m and with delivery heights of 4.5m, 6m, and 7.5m with changes in the air chamber volumes of 1L, 2L, 3L, 4L, 5L and 6L capacities.
Within the context of this work, priming or pressurizing time which is the time to attain a pressure in the chamber, increased with the volume of the air chamber of HRP. A longer time was required to produce the required pressure as the volume of air chamber increased. The maximum pressures obtained from the pump increased with the drive height.
The pumping and power efficiencies were not significantly affected by the volume of air chamber, but by the drive and delivery heights. The pumping efficiency which is defined by the ratio of water volume delivered out of the total volume discharged from the drive tank, substantially decreased as the delivery height increased. When the delivery height increased, the flow rate of delivery discharge decreased significantly. It could be explained by the fact that the given potential energy from the drive tank could pump only less water flow rate as the delivery height increased. The power efficiency was not affected by the volume of air chamber either. At a given operational conditions such as drive or delivery height, the power efficiencies for all different volume of air chamber did not change. It seemed that some differences in efficiencies and measurements of flow rates were insignificant and there were no notable trends with the volumes of air chamber.
For the drive height of 2.35 m, the pressurizing phase showed a slight increase in the frequency from 1.6 to 1.7 Hz as the volume of the air chamber increased from 1 L to 6 L at the 4 m delivery height. However, the operation phase at the drive height of 2.35 m did not show any significant changes in the frequencies for the different volumes of the air chambers.
Under the limited experimental conditions, the volume of air chamber did not make notable effects on HRP performance. The efficiencies and performance were more affected by the operational conditions such as drive and delivery heights. The volume of air chamber may be related with stability of discharge of water since the air chamber contains the pressurized water and their volume is directly related, which requires further studies.