

Ⅰ. Introduction
Efficient water use and sustained crop productivity are vital for global food security, particularly as population growth, climate change, and shifting dietary demands pressure agricultural systems (Chevuru et al., 2025). Amid these challenges, reliance on staple crops such as wheat, rice, and maize is increasingly insufficient (Jha et al., 2024), highlighting the need to promote nutrient-rich, fast-growing, low-input ‘smart-food’ crops such as buckwheat (Fagopyrum esculentum Moench) to support sustainable and climate-resilient food production (Jha et al., 2024; Lin, 2011).
In South Korea, buckwheat production remains insufficient to meet rising domestic demand (Kim et al., 2017; RDA, 2021), while climate variability, characterized by irregular rainfall and elevated temperatures, has led to yield instability and disrupted sowing and harvesting schedules (Jung et al., 2015). These challenges underscore the need for adaptive management strategies that integrate environmental factors, crop traits, and cultivation practices (Shah and Wu, 2019).
Process-based crop growth models provide a valuable tool for analyzing and predicting crop performance under diverse environmental and management conditions (Lehmann et al., 2013; Reidsma et al., 2010). Models, such as Agricultural Production Systems sIMulator (APSIM) (Holzworth et al., 2014; Keating et al., 2003), Decision Support System for Agrotechnology Transfer (DSSAT) (Jones et al., 2003), and AquaCrop (Steduto et al., 2009), simulate key crop and soil processes, including growth, phenology, biomass accumulation, yield, water dynamics, and nutrient cycling. By integrating detailed inputs on weather, soil, cultivar traits, and management practices, these models allow for accurate crop production and water footprint estimation, supporting climate impact assessments and management decisions (Chevuru et al., 2025; Mialyk et al., 2024). However, the structural complexity of crop models introduces uncertainties (Chapagain et al., 2022). Accurate simulations rely on growth stages and temperature accumulation parameters, which require careful calibration and vary across models (Chevuru et al., 2025; Seidel et al., 2018; Wallach et al., 2021). Since these parameters depend on both model structure and local conditions, their transferability is limited, making local validation essential when simulating new varieties or management practices (Ahmed and Fayyaz-Ul-Hassana, 2011).
Conducting model comparisons is crucial for identifying suitable simulation tools for specific regions and climates, as well as management scenarios. For example, Clemente et al. (2005) compared CERES-Maize and CropSyst for maize yield and biomass, while Singh et al. (2008) calibrated CERES-Wheat and CropSyst to study water-nitrogen interactions in wheat. Similarly, Chevuru et al. (2025) evaluated AquaCrop-OS and PCR-GLOBWB 2-WOFOST models for simulating yield, biomass, and water use in irrigated maize, soybean, winter wheat, and spring wheat. Despite these advances, limited research has addressed minor grains like buckwheat, particularly under temperate open-field conditions in South Korea. No comparative assessment of DSSAT and APSIM for simulating buckwheat growth and development has been conducted in this region.
This study aimed to fill this gap by evaluating the performance of APSIM and DSSAT in simulating growth, yield, and soil moisture dynamics of the Sunbaek buckwheat cultivar under rainfed conditions. Specific objectives were to calibrate both models using field observations, assess their predictive accuracy for growth, yield, and soil moisture content, and examine their potential to guide sustainable management practices under climatic variability.
Ⅱ. Materials and Methods
1. Study area
The data sets used for model calibration were derived from the field experiment in 2023 carried out at the Gochang Research Farm (35°22′ N, 126°32′ E.) in Jeollabuk-do province, South Korea (Fig. 1). The farm covers approximately 2.3 hectares and is traditionally known for barley and buckwheat production. The regional climate is classified as a humid continental climate (Lee et al., 2023) according to Köppen’s classification (Beck et al., 2018), characterized by hot, humid summers (Goo et al., 2024) and mild winters. Based on a 30-year climatological record from the Korea Meteorological Administration (KMA), the study area has a mean annual precipitation of approximately 1,111 mm and a mean annual temperature of 13.1 °C.
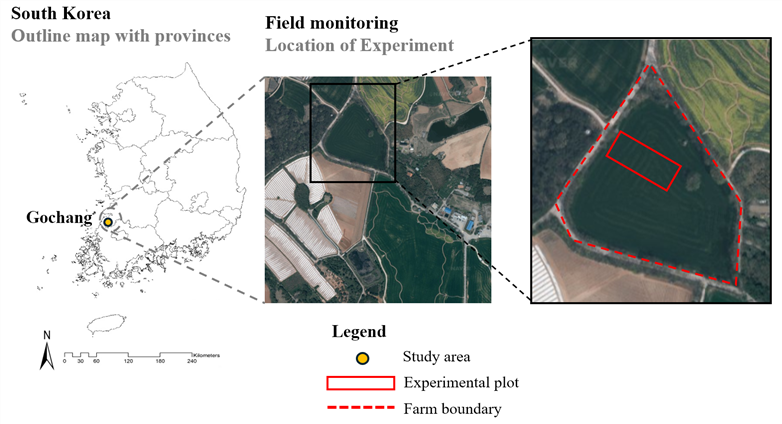
Soil samples collected before sowing were classified as a loam (39.6% sand, 39.1% silt, 21.3% clay) at the 0–30 cm depth, with a bulk density of 1.42 g cm⁻³, pH 6.3, organic carbon 1.25%, and total nitrogen 0.12%. Before sowing, minimum tillage was conducted using a rotary tiller to alleviate soil compaction, eliminate weeds, and integrate organic matter, facilitating optimal seed placement. Basal compost fertilizer was applied following common farmer practices, broadcast uniformly, and incorporated into the soil with a rotary harrow before sowing.
2. Experimental setup and data collection
On August 21, 2023, the common buckwheat cultivar Sunbaek was sown using a planter at a rate of 6 kg 10a⁻¹ with a row spacing of 15 × 8 cm in a 33 × 10 m plot. Before sowing, soil samples were collected from the experimental site and analyzed for physico-chemical properties to establish the baseline fertility status (Table 1). Weather data, including temperature, precipitation, relative humidity, wind speed, and solar radiation, were obtained from a nearby Korea Meteorological Administration (KMA) weather station in Gochang for the entire growing season (Fig. 2). Soil and crop monitoring were carried out throughout the phenological growth stages. TEROS 12 (METER Group, Inc., USA) sensors were installed at a depth of 10 cm for continuous soil moisture measurements.
Table 1
Physio-chemical characteristics of soil layers
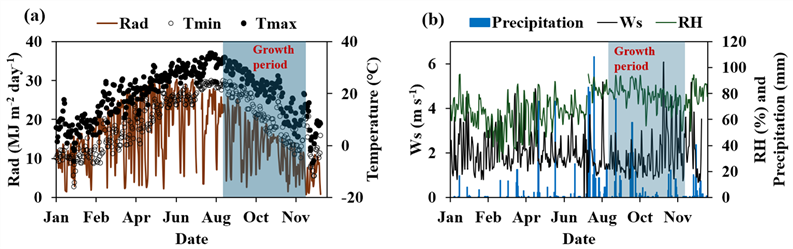
Fig. 2
Weather changes during the crop growth period (shaded area), showing (a) solar radiation (Rad), maximum temperature (Tmax), and minimum temperature (Tmin), and (b) wind speed at 2 m (Ws), relative humidity (RH), and precipitation
Crop monitoring and sampling were conducted biweekly from sowing (August 21) to the seedling stage and thereafter weekly until maturity (October 20). Samples were collected from 0.5 × 0.5 m areas at nine randomly selected locations within the plot, with three points each at the front, middle, and end of the plot, to ensure representative sampling. The measured parameters included Leaf Area Index (LAI), dry biomass, crop height, and grain (achene) weight. LAI was monitored using an LP-80 AccuPAR ceptometer (METER Group, USA), while crop height was measured using a ruler from the plant base to the top node. Harvested crop samples were separated into leaves, stems, and racemes, and oven-dried at 60 °C until a constant weight was reached. Buckwheat yield per unit area was calculated from the dry achene weight.
3. Model description
3.1 Agricultural Production systems sIMulator (APSIM)
The APSIM is a dynamic model developed by the Agricultural Production Systems Research Unit (APSRU) in Australia in the 1990s (McCown et al., 1996). It predicts crop growth, yield, and biomass by integrating climate, soil, and management information (Gaydon et al., 2017; Keating et al., 2003). Beyond crop growth, APSIM simulates soil processes, climate impacts, management effects, and pest and disease dynamics, making it a valuable decision-support tool for researchers, agronomists, and policymakers.
Soil water is simulated using the SOILWAT module, a daily water balance model adapted from Crop Environment Resource Synthesis (CERES) (Allan et al., 1986) and Productivity Erosion Runoff Functions to Evaluate Conservation Techniques (PERFECT) (Littleboy et al., 1992). It estimates daily soil water content by integrating rainfall, evapotranspiration, runoff, and drainage, with surface runoff calculated using the USDA curve number method (Glanville et al., 1984). Residue decomposition follows first-order kinetics influenced by soil temperature and moisture (Thorburn et al., 2001; Yang et al., 2018).
Crop growth, yield, and daily dry matter accumulation follow approaches from the SORKAM model (Gerik et al., 1988). Leaf area index, growth rate, and phenology are calculated from environmental conditions, transpiration, and transpiration efficiency. Yield is estimated using dry matter accumulated up to flowering and the crop growth rate at flowering (Woodruff and Tonks, 1983). Thermal time governs phenological development and is modeled through temperature and photoperiod responses (Hammer et al., 1982).
3.2 Decision Support System for Agrotechnology Transfer (DSSAT)
The DSSAT cropping system model was established in the 1980s through collaborative efforts by scientists involved in the International Benchmark Sites Network for Agrotechnology Transfer (IBSNAT) project (Jones et al., 1998, 2003). The system was developed to support agronomic research using a systems-based approach that combines information on crops, soil, climate, and management practices (Boote, 2019). Its primary goal was to improve the transfer of agricultural technologies between regions with different environmental conditions by providing a framework for analyzing and adapting production systems (Jones et al., 2003).
DSSAT is built on interconnected components, with its foundation comprising crop simulation models such as CERES for most cereals and CROPGRO for most legumes. These models simulate crop phenology, photosynthesis, biomass accumulation, and yield formation. At the same time, additional modules account for soil water balance, nutrient cycling, organic matter dynamics, daily weather processing, and management practices such as planting, irrigation, and fertilization (Climate Change Academy, 2024). Using weather, soil, management, and genotype databases, DSSAT runs simulations for diverse scenarios, with built-in tools for database development, output analysis, and comparison with observed data to evaluate performance and guide model improvement.
4. Model setup and parameter optimization
This study employed APSIM Next Generation (Holzworth et al., 2014; 2018) (ver. 2023.11.7349.0) and DSSAT v4.8.5 to simulate soil moisture dynamics, yield, and growth of the Sunbaek buckwheat cultivar during the August 21 - October 20, 2023 growing season under rainfed conditions. Since neither model includes a buckwheat-specific module, we adapted the APSIM-Oats module within APSIM and the CSM-CROPGRO-Dry bean module within DSSAT to represent buckwheat.
To simulate the cultivar, the adapted modules required genetic coefficients that describe buckwheat’s specific growth and developmental characteristics. The duration of key buckwheat growth stages was estimated using field observations and local weather data from the nearest Gochang KMA station (Fig. 2). For soil data, APSIM used information from the ISRIC global soil database (Hengl et al., 2017) accessed through its interface, while for DSSAT, a soil file was created using the SBuild tool. Both models’ soil inputs were set based on a soil survey done on August 16 before sowing.
Crop management practices were configured to reflect actual field conditions, including a plant density of 94 plants m-2, sowing depth of 2.5 cm, and row spacing of 15 × 8 cm. A basal fertilizer rate of 25 kg 10a⁻¹ was applied, with no supplementary fertilization during the growing season in accordance with local management practices.
Sensitivity analysis was conducted to identify key hydrology, soil, and crop parameters influencing model performance, which were subsequently calibrated to match observed soil moisture, growth, and yield data. In DSSAT, calibration was performed using the GLUEselect tool (Beven and Binley, 1992), and sensitivity analysis employed the built-in Sensitivity Analysis module within the interface. For APSIM, both calibration and sensitivity analysis were implemented through customized Python scripts designed to automate parameter optimization using a Monte Carlo stochastic approach (Karssenberg et al., 2010). Because the dataset was limited to a single growing season, independent model validation was not performed.
5. Model evaluation
To assess the accuracy of APSIM and DSSAT models, simulated buckwheat yield, soil moisture, LAI, phenology, and dry biomass were compared with observed field data from the 2023 growing season. Statistical differences between simulated and measured data were analyzed using a paired t-test in R (version 4.2.2), with the resulting p-value indicating the significance of mean differences between paired observations. Model performance was further evaluated using root mean square error (RMSE), mean absolute error (MAE), coefficient of determination (R²), and the index of agreement (d) statistics (Willmott et al., 2012), calculated according to equations 1-4. Lower RMSE and MAE values and higher d and R² indicated better model predictive performance (Moriasi et al., 2015).
where,  is the simulated value,
  is the observed value, n is the number of data pairs,
  is the average of simulated data, and
  is the average of observed data.
Ⅲ. Results
1. Sensitivity analysis
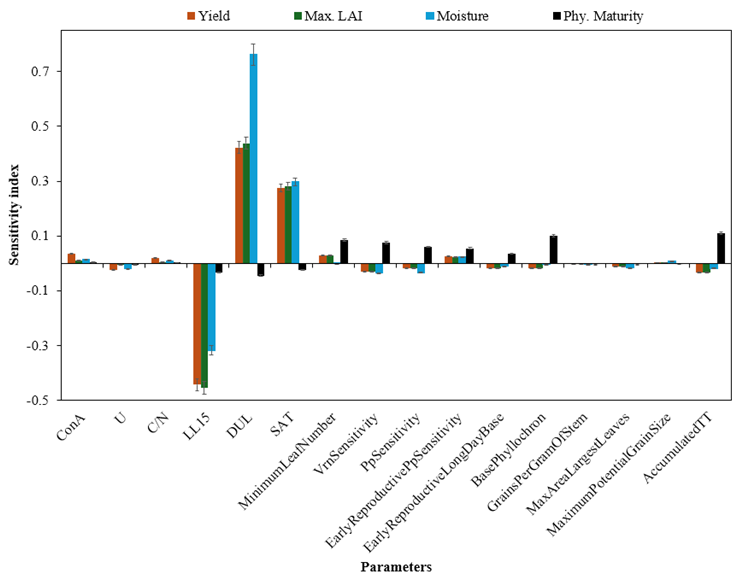
Sensitivity analysis of key hydrology, soil, and crop parameters (Tables 2 and 3) in APSIM and DSSAT revealed apparent differences in buckwheat growth responses (Figs. 3 and 4). In APSIM, soil water parameters were the most influential, strongly affecting yield, biomass, LAI, and soil moisture. The parameter DUL enhanced growth, with a Sensitivity Index (SI) of 0.42 for yield, 0.43 for biomass, and 0.76 for soil water. At the same time, SAT also contributed positively, with SI values around 0.28 for yield and biomass, and 0.30 for soil water. In contrast, LL15 reduced growth, with an SI of –0.44 for yield, –0.45 for biomass, and –0.32 for soil water. Phenological traits, including accumulated thermal time and vernalization sensitivity, moderately influenced physiological maturity (SI = 0.11 and 0.075, respectively), whereas minimum leaf number, grain traits and hydrological parameters had more minor effects.
Table 2
Hydrology, soil, and cultivar coefficient parameters of buckwheat used in the APSIM model
| Parameter | Description | Unit | Rangea | Value | |
| Hydrology | ConA | Drying coefficient for stage 2 soil water evaporation in summer | mm | 5 - 12 | 10 |
| U | Cumulative soil water evaporation to reach the end of stage 1 in summer | mm | 6 - 18 | 12 | |
| C/N | Runoff curve number for bare soil | - | 50 - 75 | 75 | |
| Soil | DUL | Drained upper limit | cm³/cm³ | 0.304 - 0.371 | 0.362 |
| LL15 | Lower limit (15 bar wilting point) | cm³/cm³ | 0.207 - 0.253 | 0.210 | |
| SAT | Saturated soil water content | cm³/cm³ | 0.376 - 0.459 | 0.440 | |
| Ks | Saturated hydraulic conductivity | mm/day | 137.82 - 168.44 | 144.96 | |
| Cultivar | AccumulatedTT | Thermal time accumulated | ℃⋅day | 660 - 800 | 665 |
| PpSensitivity | Sensitivities to photoperiod | - | 0 - 7 | 4 | |
| VernSensitivity | Sensitivities to vernalisation | - | 0 - 6 | 3 | |
| max_grain_size | Maximum grain size | g | 0.00 - 0.05 | 0.04 | |
| max_Area | Area of largest leaves | mm2 | 1000 - 3000 | 1600 | |
| GrainNumber | Grain per gram of stem | grain g-1 | 80 - 160 | 150 | |
| BasePhyllochron | Min thermal time required for a leaf to emerge | ℃⋅day/leaf | 15 - 30 | 20 | |
| EarlyReproductivePpSensitivity | The phyllochrons duration for the plant to go from flag leaf ligual appearance | - | 0 - 6 | 5 | |
| MinimumLeafNumber | Number of leaves the plant will produce when grown in long photoperiod | leaves | 8 - 20 | 14 | |
| aSoil and hydrological ranges based on Dalgliesh et al. (2016) guidelines; genetic ranges based on default oat cultivar values, refined with field observations and resampling. | |||||
Table 3
Hydrology, soil, and cultivar coefficient parameters of buckwheat used in the DSSAT model
| Parameter | Description | Unit | Rangea | Value | |
| Hydrology | SLU1 | Surface evaporation limit | mm/day | 6 - 15 | 11 |
| SLRO | Runoff curve number | - | 0.2 - 1.0 | 1.0 | |
| SLDR | Drainage rate coefficient | cm/day | 0.1 - 2.0 | 0.4 | |
| Soil | DUL | Drained upper limit | cm³/cm³ | 0.222 - 0.371 | 0.320 |
| LL15 | Lower limit (15 bar wilting point) | cm³/cm³ | 0.083 - 0.156 | 0.145 | |
| SAT | Saturated soil water content | cm³/cm³ | 0.415 - 0.501 | 0.450 | |
| Cultivar | EM-FL | Time from emergence to first flower | PTDb | 20.0 – 31.3 | 21.8 |
| FL-SD | Time between first flower and first seed | PTD | 6.0 - 13.0 | 10.0 | |
| SD-PM | Time between first seed and physiological maturity | PTD | 14.0 - 29.0 | 18.0 | |
| LFMAX | Maximum leaf photosynthesis rate at 30°C, 350 vpm CO₂, high light | mg⋅CO2⋅m⁻²⋅s⁻¹ | 0.95 - 1.00 | 0.95 | |
| SLAVR | Specific leaf area under standard growth conditions | cm²⋅g⁻¹ | 250 - 350 | 320 | |
| WTPSD | Maximum weight per seed | g⋅seed⁻¹ | 0.22 -0.66 | 0.66 | |
| aSoil ranges based on WISE defaults for loam soil (Gijsman et al., 2007); genetic ranges derived from dry bean .CUL file and adjusted with field observations and resampling. bPTD stands for Photothermal Days. | |||||
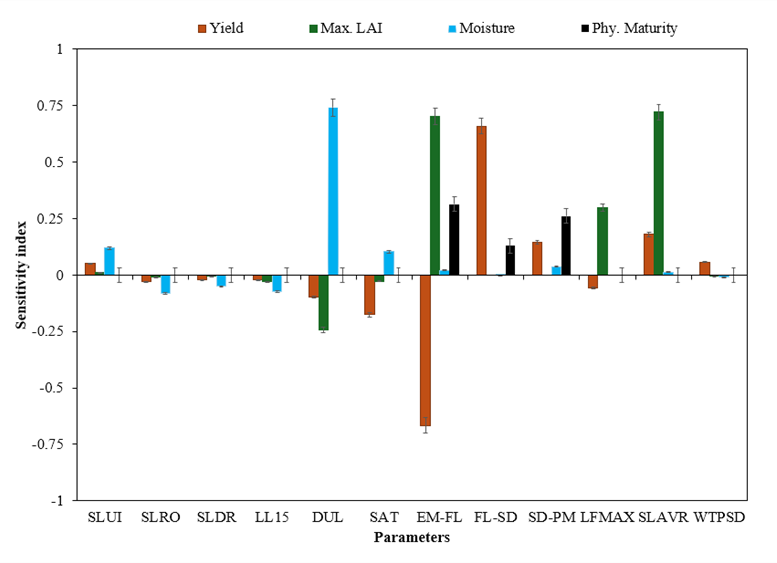
In DSSAT, phenology and crop duration parameters dominated sensitivity, although hydrological and soil properties also had measurable effects. Yield was highly sensitive to EM–FL (SI = –0.67) and FL–SD (SI = 0.66), while biomass responded strongly to DUL (SI = –1.04) and FL–SD (SI = 0.22). LAI was mainly influenced by EM–FL (SI = 0.70) and SLAVR (SI = 0.72), and physiological maturity was sensitive to EM–FL (SI = 0.31) and SD–PM (SI = 0.26). Soil parameters, including DUL and SAT, contributed moderate SI for yield, biomass, and moisture, whereas other traits, such as LFMAX and WTPSD, had minor effects.
Overall, the two models demonstrated complementary sensitivities: APSIM emphasized soil–water interactions as primary drivers of buckwheat growth, whereas DSSAT placed greater weight on phenology and crop duration. These findings underscore the importance of accurate phenological and soil water calibration and suggest that model choice can influence the interpretation of management strategies and environmental responses in buckwheat productivity.
2. Model verification
Calibration focused on key parameters governing plant growth, phenology, and soil moisture dynamics. The optimized genetic coefficients for buckwheat in APSIM and DSSAT are summarized in Tables 2 and 3, respectively. Both models utilized existing crop templates: APSIM adapted the oats module (Peake et al., 2021), while DSSAT employed the CSM-CROPGRO-Dry Bean model (Hoogenboom et al., 2019) for parameterization.
Because only one year of experimental data was available, formal model validation was not performed. Accordingly, the presented outcomes should be regarded as results from calibrated simulations rather than fully validated predictions. Both APSIM and DSSAT were subsequently used to simulate buckwheat growth, phenological development, and soil moisture dynamics during the experimental period.
3. Soil moisture dynamics
Simulated soil moisture content exhibited distinct model-specific patterns under comparable environmental conditions (Fig. 5a). A t-test revealed no significant differences between simulated and observed values for either model (p > 0.05). APSIM showed strong agreement with observations (R² = 0.95, RMSE = 2.50%, MAE = 1.80%, d = 0.97), though it slightly overestimated soil moisture content during heavy rainfall and exaggerated depletion during dry periods (Fig. 5a).
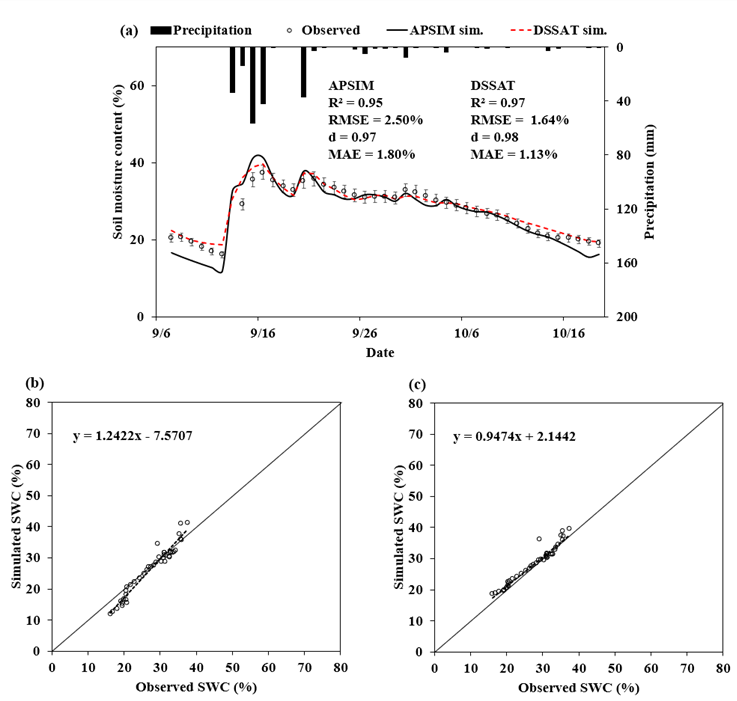
Fig. 5
(a) Comparison of observed and simulated soil water content (SWC) from the APSIM and DSSAT models, and 1:1 scatter plot of (b) APSIM and (c) DSSAT model
In contrast, DSSAT demonstrated higher accuracy (R² = 0.97, RMSE = 1.64%, MAE = 1.13%, d = 0.98), effectively capturing rapid increases in soil moisture content following precipitation but tending to underestimate depletion under dry conditions (Fig. 5b). Despite these differences, both models reliably reproduced temporal soil moisture dynamics—APSIM performing more consistently under wet conditions and DSSAT responding more sensitively to rainfall variability—highlighting structural differences in their representation of soil water processes under variable environmental conditions.
4. Crop growth and yield
Phenological development showed model-specific deviations. In the Table 4, APSIM matched emergence at 7 DAS (+40.0% relative to the observed 5 DAS), but overestimated flowering by 2 days (+6.9%), underestimated grain filling by 7 days (–17.95%), and delayed maturity by 11 days (+18.03%). In contrast, DSSAT underestimated emergence by 2 days (–40.0%) and flowering by 6 days (–20.7%) but closely captured grain filling (–20.5%) and maturity (+1.64%). Overall, DSSAT provided closer agreement with observed canopy development and maturity than APSIM.
Table 4
Observed and simulated dates of phenological stages and leaf area index (LAI) from the APSIM and DSSAT models
Leaf area development differed between the models. DSSAT slightly overpredicted the maximum LAI (2.29) compared to the observed value of 1.97, whereas APSIM substantially underestimated it (1.10) (Table 6). Both models captured the overall trend of leaf area expansion, with DSSAT showing a more rapid increase during the early to mid-growth stages, resulting in values closer to observations.
The calibration results indicate that both APSIM and DSSAT can be parameterized to reliably simulate buckwheat under the agro-climatic conditions of this study (Fig. 6). APSIM slightly overestimated grain yield by 20.2% (152.0 vs. 126.5 kg 10a⁻¹), whereas DSSAT underestimated it by 19.2% (102.3 vs. 126.5 kg 10a⁻¹). For total aboveground biomass, APSIM slightly underpredicted (201.1 vs. 230.5 kg 10a⁻¹; –12.8%), while DSSAT overpredicted (262.3 vs. 230.5 kg 10a⁻¹; +13.8%).
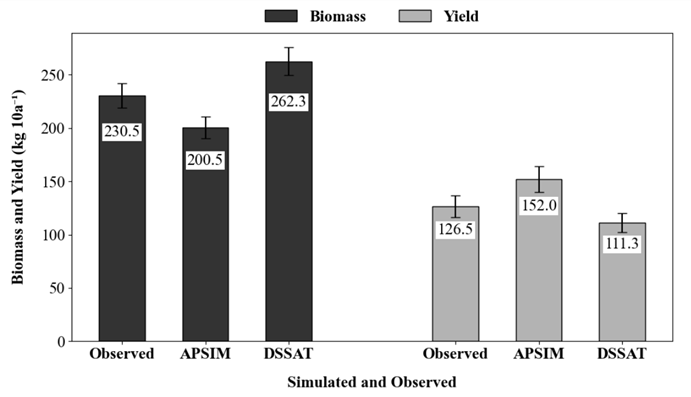
Fig. 6
Comparison of observed and simulated buckwheat biomass and grain yield predicted by the APSIM and DSSAT models
These differences reflect underlying model structures. APSIM tended to produce smoother biomass accumulation, effectively capturing overall growth trends, while DSSAT was more sensitive to short-term environmental variability, resulting in lower grain yield predictions. Nonetheless, both models accurately reproduced the general seasonal growth pattern and the relative timing of biomass accumulation, effectively capturing the dynamics of crop development under the studied conditions.
Ⅳ. Discussion
The comparative evaluation of APSIM and DSSAT revealed notable differences in simulating buckwheat soil moisture, growth, and yield, primarily reflecting structural and algorithmic variations. Both models captured general seasonal trends in these variables, but their specific predictions diverged, consistent with previous model intercomparison studies (Akinseye et al., 2017; Camargo and Kemanian, 2016; Saddique et al., 2019). APSIM slightly overestimated soil moisture under wet conditions and exaggerated depletion during dry periods, whereas DSSAT closely followed observed moisture trends during wet periods but underestimated soil water depletion under dry conditions.
These differences are primarily due to each model’s water balance formulation, even though both use a similar tipping-bucket approach (Ritchie, 1998) to simulate soil water dynamics, including infiltration, drainage, and evaporation (Boote et al., 2021). The models differ in how they simulate processes affecting soil moisture, particularly transpiration: APSIM calculates transpiration based on transpiration efficiency (TE), whereas DSSAT uses potential evapotranspiration (PET) and LAI (Boote et al., 2021). Despite these structural differences, both models satisfactorily reproduced the overall soil moisture dynamics, consistent with findings from a maize simulation study in Zambia (Chisanga et al., 2021), supporting their robustness in representing water-limited conditions.
For phenology, APSIM slightly delayed flowering and maturity, whereas DSSAT better matched the observed dates for physiological maturity but underestimated early-stage development. Comparable trends were reported in wheat, with APSIM often predicting longer crop durations (RMSE: 1–5 days) and DSSAT more accurately simulating physiological maturity (Saddique et al., 2019). DSSAT’s apparent accuracy in predicting maturity may result from its lower sensitivity to nutrient stress during phenological calculations in maize (Corbeels et al., 2016), unlike APSIM, which tends to extend phenology under nutrient-limited conditions, as observed in rice (Chaki et al., 2022). The observed durations from sowing to maturity (61–73 DAS) in this study are consistent with the 70–84 DAS reported by the Rural Development Administration of Korea (RDA, 2021) and the 56–93 DAS reported for the Yangeol and Daesan cultivars (Jung et al., 2015), supporting the reliability of both models for regional calibration.
APSIM and DSSAT differed in their simulation of biomass, yield, and maximum LAI. APSIM produced higher total biomass but slightly overestimated yield and underestimated maximum LAI, whereas DSSAT simulated lower biomass yet achieved closer agreement with observed yields and accurately predicted maximum LAI, highlighting its suitability for studies focused on reproductive growth, vegetative development, and canopy expansion. These patterns are consistent with Wajid et al. (2021), who reported that DSSAT generally provided more accurate yield predictions than APSIM for wheat. However, Saddique et al. (2019) observed an opposite trend, with APSIM underpredicting wheat grain yield. In contrast, Ahmed and Fayyaz-Ul-Hassana (2011) reported APSIM’s superior performance in simulating both dry matter and yield under rainfed wheat conditions in Pakistan, highlighting that model performance is context-dependent. It varies with crop type, environmental conditions, parameter selection, and the variable of interest.
As both models used identical soil, weather, and management inputs, the observed differences are attributed to structural and algorithmic contrasts rather than environmental variability. These structural differences include carbon allocation schemes, soil-water-nutrient feedback mechanisms, phenology algorithms, stress response mechanisms, time-step calculations, assumptions regarding light interception, and parameterization (Ash, 2011; Hoogenboom et al., 2019; Kukal and Irmak, 2020).
As no independent validation dataset was available, these results reflect the best-case performance for the 2023 season and should not be generalized to other years or regions. While both APSIM and DSSAT achieved satisfactory simulation accuracy, further refinement is needed to enhance calibration reliability under diverse agro-climatic conditions. Multi-year and multi-location calibration can reduce parameter uncertainty and improve model transferability (Li et al., 2021; Wallach et al., 2021). Integrating the complementary strengths of APSIM’s detailed biophysical processes with DSSAT’s empirical robustness offers a promising framework for more reliable simulation of buckwheat water-nutrient interactions and productivity under climate variability, providing a solid basis for informed management and decision-making.
Ⅴ. Conclusion
This study evaluated the performance of APSIM and DSSAT in simulating buckwheat growth, yield, and soil moisture dynamics under rainfed conditions in Gochang-gun, Korea. Both models effectively reproduced key hydrological and physiological processes, though with distinct strengths and limitations. APSIM provided more accurate estimates of aboveground biomass, reflecting its strength in dry matter accumulation and growth modeling, whereas DSSAT better captured grain yield, phenology, and maximum LAI, highlighting its suitability for reproductive and vegetative development studies. Both models reliably reproduced soil moisture dynamics, although APSIM slightly overestimated moisture under wet conditions and exaggerated depletion during dry periods, while DSSAT slightly underestimated moisture depletion under dry conditions. These discrepancies are attributed to inherent structural differences and crop parameterization schemes within each model. Despite these limitations, both models effectively represented buckwheat growth, providing valuable tools for water and nutrient management. Multi-season and multi-location validation are recommended to enhance robustness, yet both models hold strong potential for guiding adaptive crop management under climate variability.