

Ⅰ. Introduction
The global agricultural sector faces significant challenges in meeting food demand due to population growth and water scarcity. Over three billion people live in regions experiencing substantial water shortages, with nearly half facing severe limitations (FAO, 2020). Global per capita freshwater availability has decreased by over 20 percent in the last two decades, emphasizing the need for improving water use efficiency, particularly in agriculture, which accounts for the largest share of water consumption. In Kenya, agriculture contributes to one-third of the GDP and supports 80% of the population, but is predominantly rain-fed, making it highly vulnerable to erratic rainfall and climate change (GOK, 2019). This issue is particularly pressing in Arid and Semi-Arid Lands (ASALs), which constitute about 80% of the country’s land area, where rainfall is scarce and unreliable (Oguge and Oremo, 2018). To mitigate these challenges, irrigation plays a critical role in stabilizing crop yields, yet only 1.7% of Kenya’s agricultural land is irrigated (GOK, 2019). The 2017 drought, for example, led to a 6% reduction in maize yields, underscoring the vulnerability of rain-fed agriculture (GOK, 2018). Deficit Irrigation (DI) has emerged as a promising strategy to optimize water use by applying less water than full crop water requirements during non-critical growth stages, which can conserve water while maintaining acceptable yields (Fereres and Soriano, 2007).
Soil Moisture Deficit Index (SMDI) is a tool for assessing water stress, focusing on soil moisture content rather than plant response. SMDI provides a quantitative measure of soil water deficit, which can guide irrigation decisions to avoid over- or under-irrigation. Research on SMDI has shown its effectiveness in various cropping systems by accurately reflecting soil moisture conditions in both rain-fed and irrigated systems, providing a valuable tool for irrigation management (Narasimhan and Srinivasan, 2005). A study on wheat crops found that SMDI-based irrigation scheduling improved WP and reduced water usage by 20% without significant yield loss (Zhang et al., 2018). The implications of SMDI for irrigation management are significant. By providing a clear indicator of soil moisture status, SMDI helps optimize irrigation schedules, reduce water waste, and maintain crop yields, particularly in water-scarce regions (Narasimhan and Srinivasan, 2005).
Crop Water Stress Index (CWSI) is a remote sensing tool used to assess plant water status by measuring canopy temperature relative to ambient air temperature. It provides a non-invasive method for detecting water stress in crops, allowing for timely irrigation interventions. Recent studies have highlighted the utility of CWSI in improving irrigation management. CWSI helps to determine the precise moments when irrigation should be applied to minimize water stress without significantly affecting crop yield (Shin and Jung, 2014). This approach is particularly useful in drought-prone areas, where water resources are limited, and the goal is to maximize water productivity (WP) while sustaining yield. CWSI was to monitor water stress in olive trees, finding that it effectively identified stress conditions before visual symptoms appeared (González-Dugo et al., 2019). This early detection allowed for timely irrigation, enhancing water use efficiency and maintaining crop yield. Similarly, CWSI was applied in vineyards and reported that it improved the precision of irrigation scheduling, leading to better grape quality and yield applied (Bellvert et al., 2014). The use of CWSI in irrigation management has several implications for crop production. By providing a rapid assessment of crop water status, CWSI enables more responsive irrigation practices, reducing water waste and increasing crop resilience to drought (Idso et al., 1981; Mö Ller et al., 2007). Maintaining a CWSI value of 0.2 to 0.4, during vegetative stage of maize growth, did not significantly affect yield but resulted in substantial water savings, however, during tasseling and grain filling, the CWSI threshold was maintained below 0.2 to prevent significant yield loss (Irmak et al., 2000). CWSI threshold of 0.3 was optimal during the vegetative stages for maize however during reproductive stages, a lower CWSI threshold of 0.15 was recommended. Crop Water Stress (WS) threshold refers to the level of water stress that a crop can tolerate without a significant reduction in yield. For maize, studies have explored various WS thresholds to determine the optimal point at which irrigation should be applied to maximize water productivity (WP) and minimize irrigation water amount (IWA) during drought conditions. Research has found that applying a WS threshold of 50% (where soil moisture is allowed to deplete up to 50% of available water) during the vegetative stage did not significantly reduce maize yield but significantly saved irrigation water. This threshold can help in managing water resources (Zhang et al., 2019). Maize is highly sensitive to water stress during flowering and grain filling therefore allowing no more than 30% depletion of available water during these critical periods to avoid substantial yield losses is critical (Çakir, 2004). A dynamic WS threshold approach, adjusting thresholds based on real-time climatic data and soil moisture conditions has been proposed (Yi et al., 2022).
SWAP is a deterministic model used to simulate the movement of water, solutes and heat in variably saturated soils. It has been widely used to predict soil moisture dynamics in the vadose zone under different irrigation regimes, including DI. Recent advancements in the SWAP modeling have improved the accuracy of these predictions, aiding in better irrigation planning. SWAP was used to evaluate different irrigation strategies for maize in the Netherlands which demonstrated that the model could accurately predict soil moisture content and crop growth under different DI scenarios, allowing for the optimization of irrigation schedules (Amiri, 2017). The SWAP model was used to evaluate the impacts due to climate changes on water availability and crop yields in India, shows that adaptive irrigation strategies based on the SWAP predictions could mitigate adverse effects on crop production (Mohanty et al., 2015). The SWAP model implications for crop production are significant, as it allows for more precise irrigation scheduling based on real-time soil moisture data and crop growth stages. This precision can lead to higher Water Use Efficiency (WUE) and better crop yields, even under water-limited conditions (Janssen et al., 2017).
KALRO Kiboko demo farm in Kenya, being a government owned agricultural research facility, was selected for its reliable historical data, essential for model validation and error estimation, and its representation of ASAL regions, covering 83% of Kenya’s land mass. The research addresses water scarcity challenges, leveraging prior studies to enhance accuracy and efficiency. The site’s infrastructure, partnerships, and logistical support enable future field experiments to confirm findings. Additionally, its potential to inform regional agricultural and water management policies enhances the study’s societal relevance.
This study focuses on the application of DI to maize production in Makueni County, Kenya, an ASAL region particularly vulnerable to rainfall variability. The research aims to evaluate irrigation management strategies using the Soil Moisture Deficit Index (SMDI) and Crop Water Stress Index (CWSI), which can optimize irrigation schedules and improve water productivity. The Soil Water Atmosphere Plant (SWAP) model will be used to assess these indices and help inform more precise irrigation practices. This approach aligns with global trends in precision agriculture and addresses the urgent need for sustainable water management in the face of climate change (Narasimhan and Srinivasan, 2005;Shin and Jung, 2014; Zwart and Bastiaanssen, 2004).
By improving irrigation efficiency, this research not only seeks to enhance maize production in the ASAL regions, but also to contribute to broader efforts toward achieving sustainable development goals related to food security, water management, and climate action.
Ⅱ. Material and Methods
1. Conceptualization
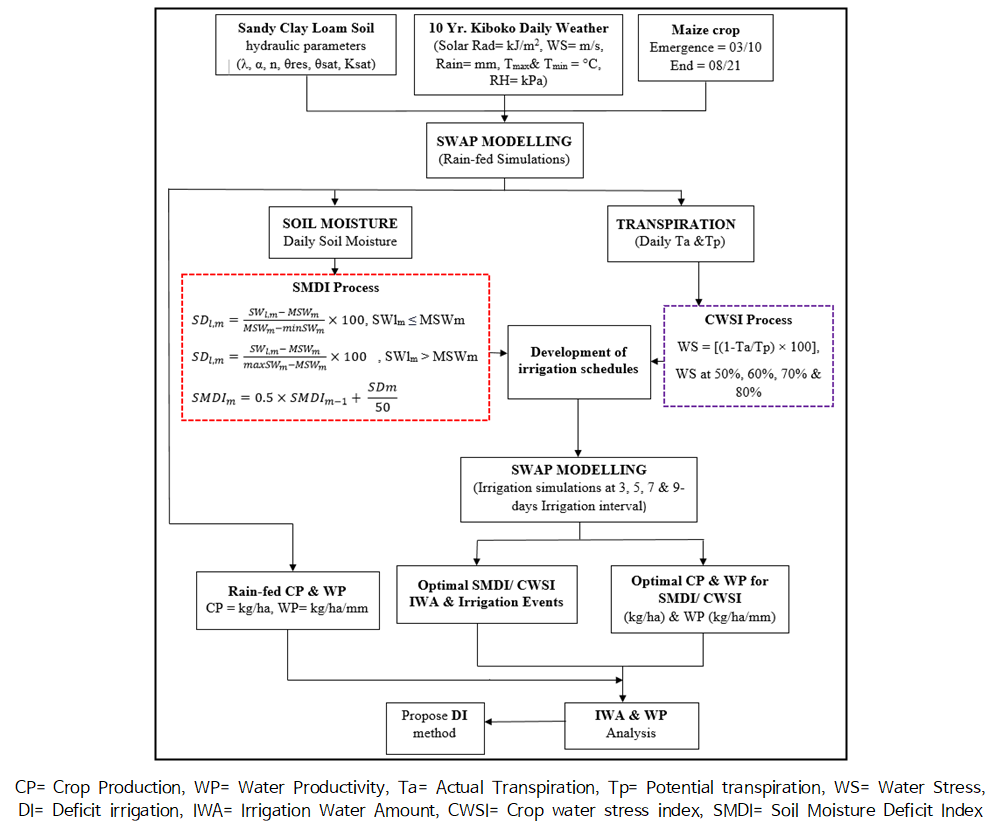
This study aimed to enhance the sustainable maize production in Kenya’s Kiboko region by applying efficient supplemental deficit irrigation (DI) strategies for managing agricultural drought conditions. The research evaluated different irrigation strategies, adjusting irrigation intervals and crop water stress levels based on the Soil Moisture Deficit Index (SMDI) and Crop Water Stress Index (CWSI) values. The SWAP (Soil-Water-Atmosphere-Plant, van Dam et al., 1997) model, incorporating a crop module, was used to simulate the soil moisture dynamics and maize production. The input parameters included the local climatic data, soil properties, and crop-specific information to identify optimal irrigation schedules for maximizing crop yield and water efficiency. Fig. 1 shows the schematic diagram of conceptual framework suggested in our approach.
1.1. The SWAP Model
The SWAP model is a sophisticated numerical simulation tool used in hydrology and agriculture to predict soil moisture content and its temporal variations (van Dam et al., 1997). This physically based model simulates the complex interactions within the soil-water-atmosphere-plant system, employing the one-dimensional Richards equation (Eq. 1) to describe soil moisture dynamics throughout the profile, solved numerically via an implicit finite difference scheme (Fuentes et al., 2020). As illustrated in Fig. 1, the SWAP model incorporates various factors, including soil hydraulic properties (Ksat, λ, α 𝜃res, 𝜃sat and n), meteorological conditions (daily temperature, precipitation, humidity, solar radiation and wind speed), and crop characteristics, to comprehensively simulate water balance within the soil-plant-atmosphere continuum (Kroes et al., 2017). Its versatility allows for the evaluation of irrigation strategies’ impacts on soil moisture content and the estimation of maize yield in kg ha-1 under varying water and weather conditions (Taparauskiene and Heng, 2008).
where θ is the water soil water content (cm3 cm-3), K is the hydraulic conductivity (cm d-1), h is the soil water pressure head (-cm), z is the vertical soil depth (cm), t is the time domain (d), C is the differential water capacity (cm-1) and S (h) is the actual soil moisture extraction rate by plant root (cm3 cm-3 d-1) defined as Eq. 2.
where Tpot is the potential plant transpiration (cm d-1), Zr is the rooting depth (cm), and αw is a reduction factor as function of h (at depth z and time t) and accounts for water deficit and oxygen stress (Wu et al., 1999). The soil hydraulic functions θ(h) and K (h) are described by analytical expressions of Eqs. 3 and 4 (Mualem, 1976; Van Genuchten, 1980).
where, Se is the relative saturation (-), θres and θsat are the residual and saturated water contents (cm3 cm-3), α (cm-1), n (-), m (-), and λ (-) are shape parameters of the retention and the conductivity functions, Ksat is the saturated hydraulic conductivity (cm d-1), and m = 1- 1/n.
SWAP estimates transpiration (Tpot, Tact), partitioned by the leaf area index (LAI) or soil cover fraction using the Penman-Monteith equation (Kroes et al., 2017; Zhao et al., 2020). The model is widely recognized and validated across various climatic and environmental contexts. It integrates both basic and detailed crop growth models (WOFOST) and includes water management functions for irrigation and drainage (Droogers, 2000; Kroes et al., 2000; Shin et al., 2013).
1.2. SMDI
One of the key outputs of the SWAP model is the daily soil moisture which has been used to derive Soil Moisture Deficit Index (SMDI), which offers valuable insights into root zone soil moisture dynamics. The SMDI ranges from -4 to +4 with negative values indicating dry conditions and positive values representing wet conditions (Khanjani et al., 2023; Narasimhan and Srinivasan, 2005). SMDI has proven to be a valuable tool for agricultural drought monitoring and irrigation management, offering insights into soil moisture deficits and aiding in drought condition assessments and irrigation planning for the Kiboko study site (Narasimhan and Srinivasan, 2005). Through iterative adjustments of irrigation water amount and adjusting irrigation intervals, the optimal water productivity was determined under the SMDI framework as shown in Fig. 1,
where, SD: Soil Moisture Deficit, SW: Soil Water Content, MSW: Median Soil Water content, minSW: Minimum weekly Soil water content, maxSW: Maximum weekly Soil water content.
1.3. CWSI
The CWSI (Eq. 8), ranges from 0 (maximum transpiration) to 1 (no transpiration), and is crucial for optimizing irrigation, by reducing water wastage and improving crop productivity (Jeyasingh et al., 2023). CWSI is a key indicator of a crop’s water status and is used to assess water stress (Eq. 9) and manage irrigation. Although early-season accuracy can be affected by partial canopy cover, integrating CWSI into irrigation systems helps monitor and manage water use efficiently (Ko et al., 2023; Nemes et al., 1999; Schaap et al., 1998),
where, Ta: Actual Transpiration, Tp: potential transpiration.
2. Numerical Experiments
The numerical experiments were conducted to determine the optimal deficit irrigation (DI) strategies to manage the agricultural drought conditions at the Kenya Agricultural and Livestock Research Organization (KALRO) Kiboko demo farm. This study site located in the semi-arid region frequently suffers from damages caused by agricultural drought due to the lack of rainfall. For this reason, we selected this study site to mitigate the impacts of drought and enhance sustainable crop production. Numerical experiments are computer-based simulations used to analyze and predict processes or systems under controlled virtual conditions. They rely on mathematical models, such as SWAP, to replicate real-world scenarios. These experiments are time-efficient, enabling researchers to test hypothetical scenarios, like changes in irrigation strategies, without costly fieldwork. Results can be iteratively refined and validated against observed data, enhancing accuracy and reliability. The numerical experiments were set as follows: (1) The SWAP model Validation and error estimation, (2) Numerical experiments based on SMDI, (3) Numerical experiments based on CWSI, (4) Evaluation of SMDI and CWSI.
The KALRO Kiboko farm is in Makueni County in the Republic of Kenya as shown in Fig. 2. The study site is a key agricultural research facility located 150 km southeast of Nairobi in Kenya (latitude -2.23, longitude 37.71). The Rosetta model, a computational tool, was used in soil characterization to estimate the hydraulic properties and other soil characteristics from easily measurable inputs like the soil texture data (sand, silt, clay proportions), bulk density and organic matter content (provided from the reference of Lubajo, 2022), to predict key outputs such as the residual and saturation water content characteristics (θres: 0.0753, θsat: 0.4396), hydraulic conductivity (Ksat: 3.705), and soil porosity (n: 1.150, α: 0.0198), based on statistical and empirical relationships through pedotransfer functions (Nemes et al., 1999; Schaap et al., 1998). We assumed the soil had homogeneous soil profile with 33 computational layers (1-10th layer: interval of 1 cm, 11th - 20th layer: interval of 5 cm, 21st - 32nd layer: interval of 10 cm and the 33rd layer: the interval of 20 cm) to a depth of 200 cm (Kroes et al., 2002). The KALRO Kiboko demo farm has the ground water table at 22 to 182 m from the soil surface (Ng’ang’a et al., 2015) Therefore, the BBC (Bottom Boundary Condition) was designated as a free drainage condition, assuming that the IC (Initial Condition) is in equilibrium with the presence of the BBC under the specified modeling conditions.
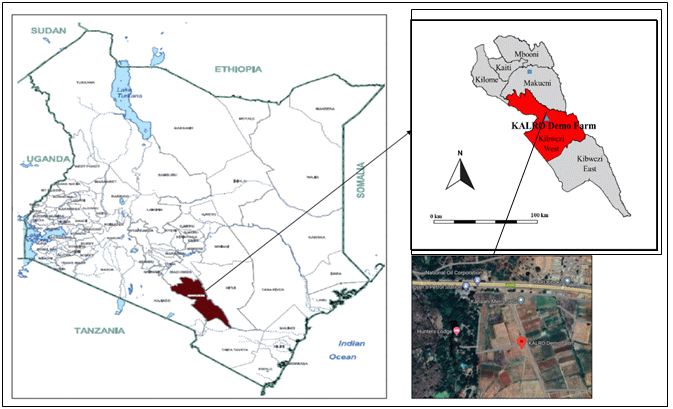
Fig. 2.
The map of Kenya highlighting the location of the KALRO Kiboko demo farm in Kibwezi West Sub-County of Makueni County. Source: database of global administrative areas (Hijmans, 2009)
The daily weather data such as solar radiation (kJ m-2), maximum and minimum temperature (°C), humidity (kPa), wind speed (m s-1) and rainfall (mm) collected from the NASA’s POWER Data Access Viewer (NASA, 2021) was used for the study period from 2013 to 2022. In this study, the field-collected maize crop input parameters included the start and end dates of the maize growing season, which defined the timeframe for crop development and simulation. These dates were essential for aligning the crop’s growth stages with environmental conditions and management practices.
2.1. SWAP model validation and error estimation
Sensitivity analysis for the SWAP model mainly focuses on understanding how variations in key parameters, such as soil properties, crop characteristics, weather data and irrigation management, influence simulation outcomes. Crucial parameters include soil hydraulic conductivity, water retention curve properties, crop coefficients, evapotranspiration and irrigation schedules. These inputs are essential for accurate model calibration and reliable results. In this study, the field-observed data was unavailable, we utilized existing studies of soil horizons at the KALRO Kiboko demo farm and applied the Rosetta model to derive pedotransfer functions. This approach effectively addressed the data gap, providing necessary soil property inputs for the model.
Therefore, validation and error estimation for the SWAP model was done based on the simulate maize yields during the long rains growing season of 2021 and 2022 at the KALRO Kiboko farm based on field data validation exercise for years 2022 and 2021 in Kibwezi West sub county from State Department for Crops Development. The performance evaluation, comparing simulated yields to actual field data, utilized statistical measures of the Root Mean Square Error (RMSE) in Eq. 10, Normalized Mean Square Error (NMSE) in Eq. 11 and Mean Absolute Percentage Error (MAPE) in Eq. 12. For error estimation metrics in this study, RMSE closer to 0, NMSE under 0.1, and MAPE under 10% indicate good accuracy between the observed and simulated maize yields, while MAPE between 10-20% may still be acceptable but reflects reduced accuracy (Chai and Draxler, 2014).
where Sy is the simulated yield (kg ha-1), Oy is the observed crop yield (kg ha-1) and n is the number of observations
2.2. Numerical Experiment based on SMDI
The numerical experiments were conducted to analyze the irrigation water amount (IWA) and water productivity (WP), based on the SMDI with the irrigation intervals (II) of 3, 5, 7 and 9 days. Through the iterative adjustments of IWA and adjusting II, the optimal WP was determined under the SMDI framework as shown in Fig. 1. For every year in the study period from 2013 to 2022, SMDI was determined for developing irrigation schedules, which yielded values for the irrigation water amount (IWA), irrigation dates and water Productivity (WP). The water resources essential for both the rain-fed and irrigated agriculture are increasingly strained, highlighting WP (Eq. 13), as the efficiency of converting water into food (Bessembinder et al., 2005; Molden, 1997).
where WP is water productivity, Yi,r is the crop yield (kg ha-1) due to deficit irrigation and rainfall and Yr is crop yield (kg ha-1) attributed to rainfall only and IWA is the total irrigation
2.3. Numerical Experiment based on CWSI
The numerical experiments were conducted to analyze the IWA and WP based the maize crop water stress. CWSI was used to develop the irrigation schedules, which yielded values for the IWA, Irrigation dates and WP. The irrigation intervals were set with the intervals of 3, 5, 7 and 9 days, while CWSI values of 0.5, 0.6, 0.7 and 0.8 were applied from the study period 2013 to 2022.
2.4. Evaluation of SMDI and CWSI
The evaluation of the SMDI and CWSI values aimed to identify the most optimal irrigation strategy for the study area. Then, we determined the irrigation intervals under SMDI and CWSI that can support the sustainable maize production from 2013 to 2022. The Levene’s test (Eq. 14) and the independent t-test (Eq. 15) were used to assess the equality of variances for a within and among the SMDI and CWSI outputs.
The Levene’s test checks if two or more groups have equal variances, which some tests require. The independent t-test then compares the means of two groups to see if they differ, using the Levene’s results to choose between equal or unequal variance assumptions (Park, 2018). The findings of the study informed recommendations for implementing irrigation practices that align with moisture levels and crop needs, ultimately enhancing water productivity and long-term sustainability.
where Yij is each observation in group j,  is the mean of group j, W is the Levenes test, T is the independent t-test, N is number of observations, k is number of groups, Nj is number of observations in group j,
  is the mean of Zij in group j,
  ̅ is overall mean of Zij,
  and,
and,  are the means of group 1 and group 2, n1 and n2 are sample sizes in group 1 and 2,
  and
and  are the sample variances for group 1 and group 2.
Ⅲ. Results and Discussion
In this study, we employed the numerical experiments to evaluate the optimal irrigation and water productivity for maize based on SMDI and CWSI at the KALRO Kiboko demo farm during the study periods of 2013 to 2022. The rainfall variability between March and June from 2013 to 2022 at the KALRO Kiboko demo farm (Fig. 3) significantly impacted on the maize production similarly with the findings of Omoyo et al., 2015. The region experienced the alternating periods of drought and excessive rainfall with no clear trend of increasing or decreasing rainfall. This variability caused the inconsistent yields in the rain-fed maize crop, highlighting the need for supplementary irrigation during the dry years. The rainfall fluctuations were used in the analysis of the soil moisture (SM) dynamics at the vadose zone versus the date of the year (DoY) rain-fed conditions as shown in Fig. 4 and underscore the importance of adaptive water management strategies to ensure sustainable agriculture in response to broader environmental influences. Fig. 4 helped in visualization of the soil moisture status prior to any irrigation was carried out at the KALRO Kiboko study site. The SM during the growing period (69th DoY to 138th DoY with 2018) have the high observed average SM above 0.4 cm3 cm-3 compared to 2014 and 2019 with the average SM below 0.3 cm3 cm-3. The field capacity for Sandy clay loam ranges from 0.27 to 0.33 cm3 cm-3 whereas the permanent wilting point ranges from 0.13 to 0.15cm3 cm-3. Therefore, the soil moisture above 0.4 cm³ cm-3 in sandy clay loam soils supports crop growth but requires careful management to avoid waterlogging, nutrient leaching, and runoff risks. (Viji and Prasanna, 2012).
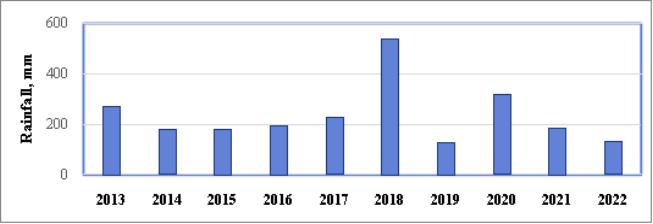
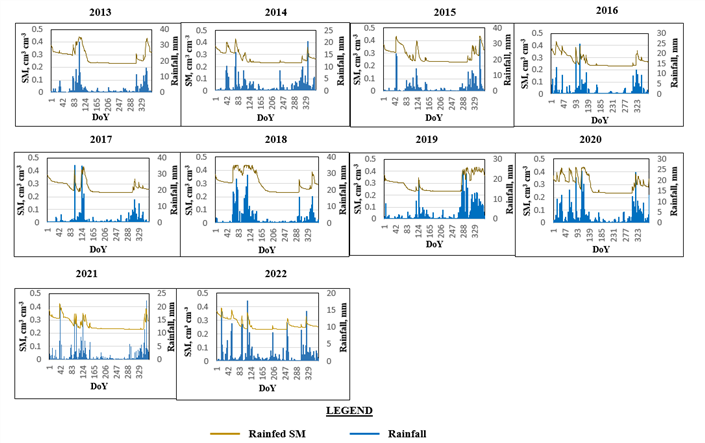
Fig. 4.
The daily soil moisture (SM) dynamics in the vadose zone based on the rainfall at the KALRO Kiboko farm during the long rains season (crop growing periods from 69th to 138th in DoY) in the study period (2013- 2022)
The soil at the KALRO Kiboko farm is predominantly sandy with the sand content ranging from 65.4% to 72.9%, the low silt from 2.1% to 7.7% and the clay content from 25% to 28%, except in the deeper layers where clay slightly decreases as shown in Table 1. The high sand content leads to the low water-holding capacity and good drainage, supported by the high Ksat values of 4.4 cm day-1 in the top layer, which decrease with depth, indicating the slower water movement due to compaction (Lipiec and Hatanob, 2003). The bulk density increases from 1.3 g cm-³ to 1.6 g cm-³ with depth, restricting root growth and reducing water uptake efficiency, especially during the dry periods (Shaheb et al., 2021). The residual and saturation water content (θres and θsat) suggest that the topsoil holds more water when saturated, while the deeper layers exhibit the reduced water-holding capacity consistent with the findings on the sandy soils (Dukes and Scholberg, 2005). Efficient irrigation strategies are crucial to ensure the optimal moisture in the topsoil where most root activity occurs. The uniform residual and saturation water content across the profile allows for the consistent irrigation management, although adjustments based on the bulk density and Ksat variations are needed (Fang and Su, 2019).
Table 1.
Derived soil hydraulic properties from Rosetta Model used in the SWAP model for the KALRO Kiboko farm
1. SWAP validation and error estimation
The comparison of simulated and observed maize yields for the long rains of 2021 and 2022 at the KALRO Kiboko farm in Kibwezi West Sub-County shows that the model closely approximates the real conditions. The simulated yields were 1,193 kg ha-1 and 478 kg ha-1, while the observed yields were 1,083.3 kg ha-1 and 500 kg ha-1 (State Department for Crops Development, 2022). Performance metrics of the simulated yields fall within ± 10% of the observed maize yield values of 2021 and 2022. The MAPE is 7.3% indicating model accuracy of 92.7%. This good agreement between the observed and simulated crop yields under the rain-fed conditions also indicate the robustness of the SWAP model that conducts the numerical experiments in optimizing irrigation and water productivity for maize crop.
2. SMDI-Based Irrigation strategy findings
This study demonstrates the significant variation in the WP of maize under different irrigation intervals using SMDI as shown in Table 2 with the results influenced by the irrigation frequency and climatic conditions as shown in Table 3. Our findings are reinforced by the other study findings that highlight the importance of irrigation scheduling for improving water productivity and sustainability (Viji and Prasanna, 2012; Wang et al., 2021; Yin et al., 2016).
Table 2.
The results of mean WP based on SMDI at 3, 5, 7 and 9- day irrigation interval for the KALRO Kiboko farm during the study period (2013-2022)
For the 3-day irrigation interval, we found that the average WP was 16.0 kg ha-1 mm-1, but the performance dropped in the dry years, such as 2017 (8.6 kg ha-1 mm-1) and 2019 (9.7 kg ha-1 mm-1), compared to the wetter years like 2015 (22.4 kg ha-1 mm-1). The frequent irrigation led to the inefficient water use, whereas the irrigation schedule should balance soil moisture without the prolonged saturation to ensure proper soil aeration and healthy root growth (Ali et al., 2020). The 5-day interval in this study showed the higher average WP of 17.3 kg ha-1 mm-1 and performed well across varying the climate conditions. For example, in the drought year of 2017, the result showed that WP dropped to 10.3 kg ha-1 mm-1, but WP was 23.0 kg ha-1 mm-1 in the wetter year of 2015. It shows that this interval optimizes water use without sacrificing yield (Du et al., 2010). At 7-day interval we determined the highest average WP of 18.9 kg ha-1 mm-1. However, the model performance was inconsistent with the poor results in the drought years (9.1 kg ha-1 mm-1 in 2017), but the high productivity in the wetter year of 2020 (25.2 kg ha-1 mm-1). With the 9-day interval, we observed an average WP of 18.5 kg ha-1 mm-1, but performed poorly during droughts, such as in 2017 (10.1 kg ha-1 mm-1). The extended irrigation intervals in the drought conditions led to the significant water stress, making it less effective during droughts (Geerts and Raes, 2009).
Overall, in this study we identified that the moderate interval, especially the 7-day, balances water use and productivity, making them more sustainable for the maize production under varying conditions. The field scale crop and irrigation information based on SMDI with the 7- day irrigation interval for the KALRO Kiboko farm during the study period (2013-2022) is shown in Table 3 while the SMDI profile for irrigation scheduling, with the vadose zone soil moisture profile under the rain-fed and irrigated conditions is illustrated in Fig. 5.
Table 3.
The simulated field scale crop and irrigation information based on SMDI and 7- day irrigation interval for the KALRO Kiboko farm during the study period (2013-2022)
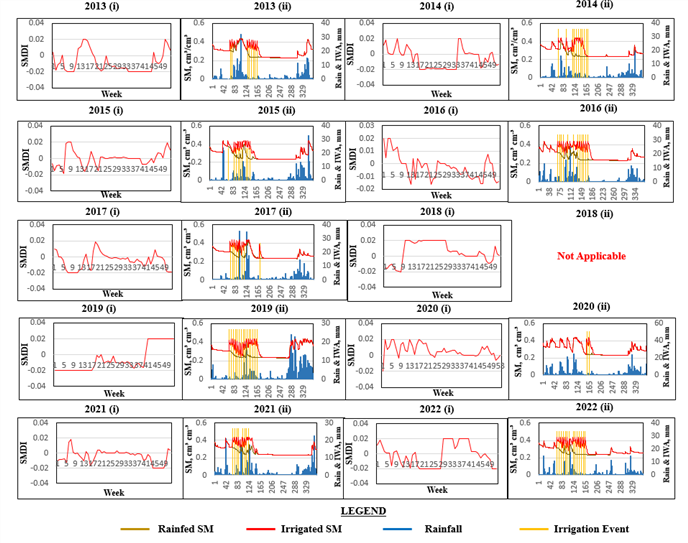
Fig. 5.
The analyzed vadose zone SM dynamics based on SMDI at 7- day irrigation interval while comparing Rainfall and IWA for the KALRO Kiboko farm during the long rains of study period (2013-2022). (i) Represents the SMDI profile for irrigation scheduling, (ii) Represents the vadose zone soil moisture profile, rain and IWA
3. CWSI-Based Irrigation strategy findings
In this study, we examined the WP in maize under the different WS thresholds of 50%, 60%, 70% and 80% and irrigation intervals of 3, 5, 7 and 9 days in the study period of 2013 to 2022 as shown in Table 4. The study findings highlighted the relationship between irrigation frequency, water stress and crop performance. The study area has the variable rainfall and soil moisture conditions as shown in Table 5.
Table 4.
The results of mean WP based on the maize crop water stress at 50, 60, 70 and 80% thresholds and at varying irrigation intervals (3, 5, 7 and 9- days) for the KALRO Kiboko demo farm during the study period (2013-2022)
Table 5.
The simulated field scale crop and irrigation information based on CWSI at 60% threshold level and 7- day irrigation interval for the KALRO Kiboko farm during study period (2013-2022)
At the 3-day irrigation interval, we noted that the highest WP (13.8 kg ha-1 mm-1) occurred at the 70% WS threshold, while the lowest (13.0 kg ha-1 mm-1) which was at 50% WS threshold. The average WP variability (0.8 kg ha-1 mm-1) suggests that the frequent irrigation maintained the WP, but the excessive water use raised the sustainability concerns (Du et al., 2010; Sangakkara et al., 2010). For the 5-day irrigation interval, we noted that the highest WP (16.6 kg ha-1 mm-1) was at the 60% WS threshold, while the lowest WP of 14.7 kg ha-1 mm-1 was at the 50% threshold. This irrigation interval had the highest WP variability of 1.91 kg ha-1 mm-1. In the 7-day irrigation interval, we noted as the most stable WP, with the highest WP (15.9 kg ha-1 mm-1) at the 60% WS threshold and the lowest WP (15.4 kg ha-1 mm-1) at the 80% WS threshold hence providing the lowest WP variability (0.5 kg ha-1 mm-1). We determined this as the optimal deficit irrigation strategy, which is supported by findings from other studies on WP (Fereres and Soriano, 2007). At the 9-day irrigation interval, we noted that the highest WP (16.4 kg ha-1 mm-1) at the 50% WS threshold and the lowest WP (15.2 kg ha-1 mm-1) at the 80% WS threshold but the higher WP variability (1.2 kg ha-1 mm-1) raised concerns about increased water stress and reduced productivity during drought (Zwart and Bastiaanssen, 2004).
Therefore, to maintain the high WP with minimal water use, the 7-day irrigation interval at the 60% WS threshold is recommended. The field-scale crop and irrigation data using this strategy at the KALRO Kiboko farm (2013-2022) are summarized in Table 4, with the CWSI profiles for irrigation scheduling and vadose zone soil moisture under rain-fed and irrigated conditions shown in Fig. 6. This approach is ideal for water-scarce regions, optimizing irrigation efficiency and sustaining WP (Ali and Mohammad, 2005). The shorter intervals are less sustainable due to the high water demand, while the longer intervals risk water stress in the dry conditions. This analysis shown in Table 4 examines the water productivity in maize under different CWSI thresholds of 50%, 60%, 70%, and 80% and irrigation interval of 3, 5, 7, and 9 days from 2013 to 2022. The findings highlight the balance between irrigation frequency, water stress and crop performance. The lowest average WP (13.0 kg ha-1 mm-1) was at 50% CWSI at 3- day irrigation interval while the highest average WP (16.6 kg ha-1 mm-1) was at 60% WS with 5-day irrigation interval.
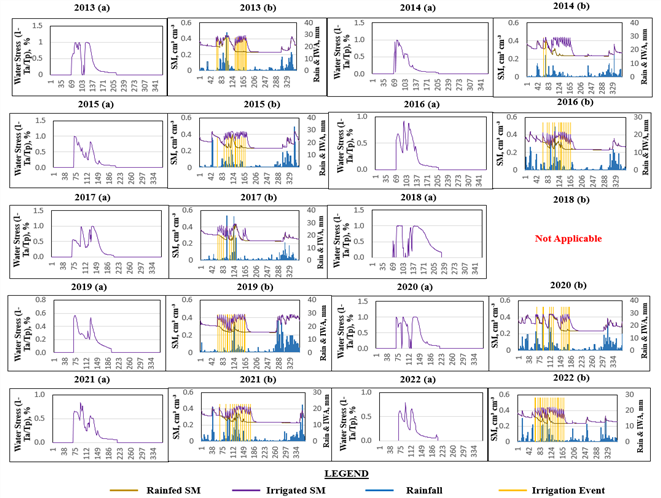
Fig. 6.
The analyzed vadose zone SM dynamics based on CWSI at 60% WS threshold and 7- day irrigation interval for the KALRO Kiboko farm during the long rains of study period (2013-2022). (a) Represents the CWSI profile for irrigation scheduling, (b) represents the vadose zone soil moisture profile, rain and IWA
4. Evaluation of SMDI and CWSI
We compared the SMDI and 60% CWSI irrigation strategies, all at the 7-day irrigation interval, focusing on the irrigation frequency, IWA and WP across varying the weather conditions as shown in Table 6. We found that wetter years had more irrigation cycles, while the drier years had fewer. The CWSI peaked in 2019 with 15 cycles and dropped to 10 in 2020 while the SMDI showed greater adaptability, with 8 cycles in 2021 and 15 cycles in 2019. We also observed that no irrigation was required in 2018 due to enhanced rains (Omoyo et al., 2015).
Table 6.
The results of comparison of SD for IWA and WP based on WS at 60% threshold at 7- day interval and SMDI at 7- day interval for the KALRO Kiboko farm during study period (2013-2022)
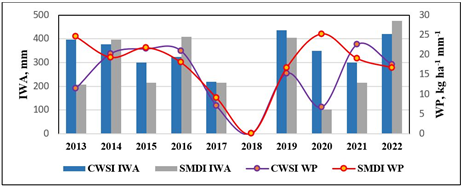
In the study analysis of IWA, we noted that CWSI used more water, with 435 mm in 2019 compared to 220 mm in 2017, as shown in Table 5. SMDI was more efficient, with 476 mm in 2022 and just 102 mm in 2020, demonstrating better adaptability to the varying conditions. In 2013, CWSI applied 396 mm of water compared to the SMDI’s 208 mm, but SMDI achieved better WP, indicating more efficient water use (Du et al., 2010; Fereres and Soriano, 2007).
We also noted that the WP for CWSI peaked at 22.53 kg ha-1 mm-1 in 2021 but dropped to 6.73 kg ha-1 mm-1 in 2020, highlighting that the higher water use doesn’t always improve productivity. Conversely, SMDI consistently achieved better WP, peaking at 25.24 kg ha-1 mm-1 in 2020 despite the lower water use, demonstrating its efficiency in the water-scarce conditions. We noted that even in drought years, SMDI maintained higher WP, showing resilience to water stress. In wetter years like 2013 and 2022, SMDI maintained better WP than CWSI, making it the more sustainable option for irrigation in water-limited environments.
In the Levene’s test and the independent T-tests, we compared the IWA and WP between CWSI at 60% WS threshold and SMDI, all with a 7-day irrigation interval as shown in Table 7. The Levene’s test showed significant variability in IWA at a 93% confidence level and in the WP at 75% (Geerts and Raes, 2009; Park, 2018). The independent T-tests yielded the p-values of 0.3 for IWA and 0.3 for WP, suggesting that CWSI requires more water while SMDI is linked to the higher productivity (Chai et al., 2016; Khan et al., 2021).
Table 7.
The comparison results for CWSI at 60% WS threshold at 7- day irrigation interval and SMDI at 7- day irrigation interval for Means, SD, Levene’s and independent t- tests
| Variable | Method | Means | SD | Levene’s Test (sig) | Independent T-test (sig) |
| IWA | CWSI | 346.78 | 68.51 | 0.007 | 0.289 |
| SMDI | 293.67 | 128.14 | |||
| WP | CWSI | 15.90 | 6.16 | 0.245 | 0.265 |
| SMDI | 18.92 | 4.84 | |||
| SD= Standard Deviation, Sig= Significance | |||||
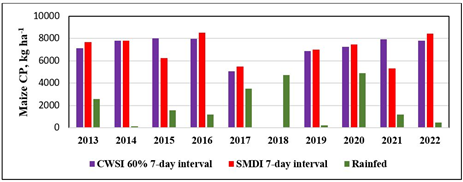
We studied the maize production under the rain-fed conditions in Fig. 7 (a), CWSI in Fig. 7 (b) and the SMDI in Fig. 7 (c) over the study period (2013-2022) and also compared the rain-fed, CWSI and SMDI for general visual interpretation as illustrated in Fig. 8. The comparison was also done on IWA and WP for both SMDI and CWSI as shown in Fig. 9. The rain-fed production was highly variable, with the yields strongly dependent on the rainfall, leading to the inconsistent results in the KALRO Kiboko farm. We observed that the CWSI- stabilized yields by increasing the water input, boosting the production by 25-30% over the rain-fed farming but with a higher water use inefficiency, particularly in the dry years. We noted that SMDI outperformed both CWSI and the rain-fed conditions, increasing the yields by 40-45% while using less water than CWSI. SMDI maintained the yields during the dry conditions and optimized the irrigation during the wet conditions, making it the sustainable and water-efficient strategy. This highlights the SMDI’s potential for improving irrigation practices in semi-arid regions, as seen in similar studies (Ali and Mohammad, 2005; Dabach et al., 2013; Fattahi et al., 2018; Khan et al., 2021; O’Shaughnessy and Evett, 2010).
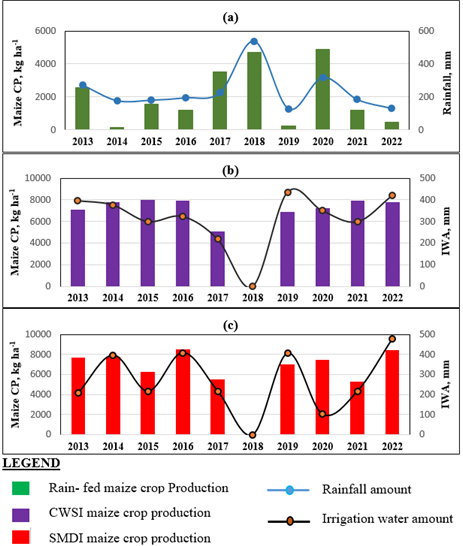
Fig. 7.
The comparison of the Maize crop production versus rainfall and IWA. (a) Rain- fed conditions, (b) CWSI at 60% threshold at 7- day irrigation interval, (c) SMDI both at 7- day irrigation interval
Ⅳ. Conclusion
This study aimed to optimize deficit irrigation strategies for sustainable maize production at KALRO Kiboko demo farm, focusing on rainfall variability, soil moisture and irrigation management from 2013 to 2022. The findings demonstrated the effectiveness of the Soil Moisture Deficit Index (SMDI) strategy in improving water productivity (WP), with a 7-day irrigation interval boosting maize yields by 40-45% compared to rain-fed conditions. The SMDI strategy achieved an average WP of 18.9 kg ha-1 mm-1, while rain-fed conditions yielded 7.7 kg ha-1 mm-1. Additionally, comparing soil moisture monitoring with the Crop Water Stress Index (CWSI) allowed for more precise irrigation scheduling, increasing water use efficiency. A total of 294 mm of irrigation water was applied during the growing season, with an irrigation frequency of 15 days. The SWAP model effectively simulated maize yields under different irrigation conditions, confirming its potential for optimizing water management. These results underscore the value of deficit irrigation strategies in addressing rainfall variability challenges in semi-arid areas, leading to higher crop yields and better water conservation. The study recommends adopting SMDI-based irrigation systems, particularly in water-scarce regions and supporting farmers in using soil moisture monitoring tools to optimize irrigation. Further research should refine these strategies to accommodate varying soil types and climate conditions. Additionally, assessing the socio-economic impacts of water-efficient technologies on farmers is essential for promoting sustainable agricultural practices and food security in semi-arid areas.