

Ⅰ. Background and Purpose
Drainage improvement is critical to the cultivation of upland crops in paddy fields because poor drainage undermines the growth of crops and decreases the yield owing to wet injury. Underdrainage is the main drainage method applied for preventing the wet injury of upland crops cultivated in paddy fields.
Underdrainage is applied to improve the soil’s air permeability by eliminating excessive moisture in the soil, increase the productivity of crops by minimizing the moisture stress caused by insufficient soil oxygen, and increase the efficiency of farm work by improving the work environment (Skaggs et al., 1982).
The currently used underdrainage method consists of burying polyvinyl chloride (PVC) perforated pipes, which can be used semi-permanently in the soil, and filling them with filter materials such as rice husks.
In recent years, it was reported that the installation cost of underdrain can be reduced by making the drain-spacing less than 5 m using a horizontal mat drain type with a width of 50 cm, located just above the corrugated perforated drain pipes, instead of using the existing excavation type of draining technique with corrugated perforated drain pipes of 100 mm diameter and a drain spacing of 10 m (Kim et al., 2019). Additionally, the proposed technique has led to the distribution of the displacement to be maintained in the allowable range (qmin > 10 mm/day), in turn increasing the subsurface drainage efficiency.
When the installation of underdrain is performed by laying a corrugated perforated drain pipe and envelope into the paddy soil, the draining capability is maintained for a longer time. However, this method has a disadvantage in that its installation is costly and time consuming compared to the mole draining method. Currently, mole drains that can be easily installed with low costs are in demand in farming sites. In this study, we focused on a method that is easy to use, has low installation cost using a mole draining method and does not incorporate a corrugated perforated drain pipes and envelopes into the paddy soil.
Kim et al. (1991) reported that, amongst the available underdrainage methods, mole drains using a bullet drainer can reduce the required cost, effort, and time.
In the past research, James (1957) investigated the agricultural drainage and proposed that the appropriate depth, interval, and length of mole drains should be 0.30~0.33 m, 1.52~9.14 m, and 3.65~9.14 m, respectively. Theobald (1963) stated that the depth and interval of the mole drains should be 0.75 m and 2~5 m, respectively, as per the typical construction standards. Lee and Broughton (1973) investigated the correlation between the change in the groundwater level and the drainage depth and interval, and reported that the groundwater level in clay soil rapidly changed at the drainage depth of 1.37 m and interval of 6.10 m. This result can vary according to the region’s soil texture and groundwater level, and the mole drain size.
Ji (1981) reported that the target amount of underground drainage for cultivating upland crops in paddy fields should be 50 mm/day, the allowable days for surface residual water should be less than 1 day, the rate of ground-water-level lowering after 2~3 days following a rainfall should be in the range of 0.4~0.5 m, and the coefficient of permeability should be in the range of at least 4~10 cm/s.
Jung et al. (1969) developed a mole drainer attached to a tractor, proposed work standards for mole drainage in reclaimed tidelands, and verified the work efficiency and desalination effect. Chun et al. (1994) reported that the mole drainage in a soybean field improved the drainage rate and soil structure, and that the wet injury in the control field resulted in poor growth.
Doh et al. (1994) investigated the physical properties of soils after promoting the underground drainage by installing underdrainage in a poorly drained paddy field, and found that the air and water permeability increased, while the soil’s moisture content, volume density, and soil hardness decreased in the underdrainage plot, compared with the conventional and surface drainage plots; thus, the soil changed to upland soil.
A mole drain formed using a bullet drainer is cheaper and easier to use in underdrainage. However, it is difficult to maintain the drainage function because, with time, the underdrain shape is broken by the soil weight etc.
In addition, if the gap between the culverts is wide, there is a problem that the underground drainage is poorly functioned in the space between the culverts (Kim et al., 2019). In consideration of these aspects, this study aimed to develop a mole drainer with an underdrainage effect for single crop cultivation with one puncture by attaching a mole drainer to a tractor before crop cultivation.
Since the corrugated perforated drain pipe and the envelope are not used for the mole drainer, the space between the culverts is also adjusted to be relatively easy. We tried to reduce the time and cost of the work involved in mole draining and to make it easy and simple to install culvert in farmhouses that lack sufficient labor during the peak farming season.
When designing a mole drainer, we tried to reduce the traction force of the drainer and minimize the occurrence of cracks in the soil, caused by the vibration of mole drainer attached to tractor.
Therefore, we designed and manufactured various types of mole drainer including the existing model by making the areas of the perforated holes identical to one another. Subsequently, we conducted an indoor traction test to identify a mole drainer that required the smallest traction and tried to examine the effect of such a mole drainer on the drainage improvement on an actual agricultural site.
Ⅱ. Research Method
1. Manufacture of various types of mole drainer and indoor traction test
Various types of mole drainer were designed and manufactured as can be seen in Table 1. and the diameter of perforated hole is designed to be 60 mm, the traction test was conducted by unifying the area of the perforated hole.
Table 1
Various types of mole drainer
| Division | Type | |||||
| Circle (the existing model) | Round | Double | Chain | Inverted- triangle | Square | |
| Shape |  | 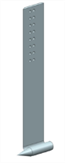 |  | 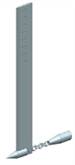 | 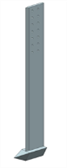 |  |
| Shape of perforated hole |  |  |  |  |  |  |
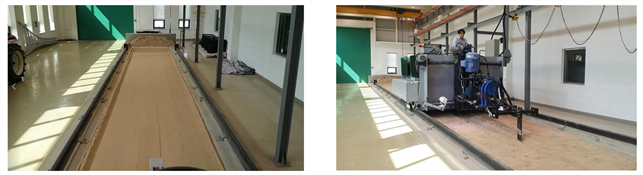
To perform the traction test for the manufactured mole drainer under uniform soil conditions, the test was conducted in an indoor artificial soil test site, which was 26 m in length and 2.6 m in width. The traction force was measured three times while moving the mole drainer for a distance of 15 m at a speed of 0.3 m/s and at a depth of 40 cm for bullet (Fig. 1). As a result of the traction test, the chain type mole drainer generated a traction of 538.4 kgf, which was considered the smallest traction among the six mole drainers (Table 2). It is considered that the traction is relatively small because the bullet edge initially forms a small hole, and then the bullet rod is inserted into the small hole and expands it such that the soil around the small hole is kept in close contact. In addition, it is observed that the vibration of the tractor implement is relatively low because the drain bullet rod is connected to the shank with the chain.
Table 2
Result of traction test for various types of the mole drainer (unit: kgf)
| Division | Type | |||||
| Circle (the existing model) | Round | Double | Chain | Inverted-triangle | Square | |
| Average | 560.1 | 570.8 | 607.6 | 538.4 | 702.8 | 611.6 |
| Maxium | 723.7 | 692.3 | 670.4 | 606.3 | 1,016.3 | 843.4 |
| Minimum | 466.5 | 437.0 | 522.1 | 444.2 | 539.4 | 531.5 |
Therefore, the purpose of this study was to examine the effect on the drainage improvement in actual agricultural site by applying a chain type mole drainer with the smallest traction.
2. Design and feature of chain type mole drainer
The chain type mole drainer comprises a bullet edge, bullet rod, chain, and shank, as shown in Fig. 2. The chain type mole drainer was designed such that the bullet rod is connected through a chain instead of forming one body with the shank to allow the chain to offset the tractor work machine vibrations, and thus prevent the perforated soil from cracking as a result of the vibration.
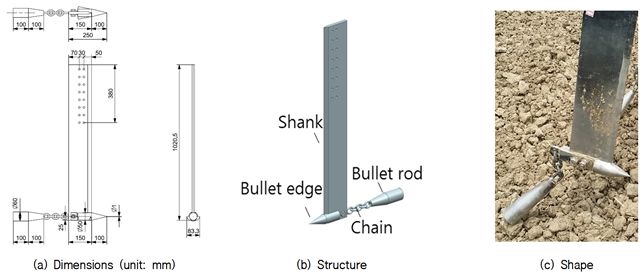
The dimensions of the mole drainer shank are designed to be identical to those of the support of the tractor-attachment-type subsoil crusher blade used in farms, such that it can be attached to the connectors of existing tractor-attachment-type subsoil crushers.
In a numerical analysis study by Jeon et al. (2017), the bullet rod was designed with a circular shape, which has been reported to be more stable in terms of stress and deformation compared with rectangular or triangular shapes. As the diameter of the bullet rod increases, the traction resistance becomes higher, and as the diameter decreases, the traction resistance becomes smaller but tends to easily enable the blocking of the perforated holes. When the diameter of the bullet rod is larger than 100 mm, the traction resistance of the tractor significantly increases. In such cases, only large tractors with a horsepower of 100 HP or higher can be used in the field. In contrast, when the diameter of the bullet rod is smaller than 50 mm, the perforated hole is small and clogging owing to soil residue is easily induced during heavy summer rains. Therefore, in this study, we set the bullet rod diameter to 60 mm.
3. Test field
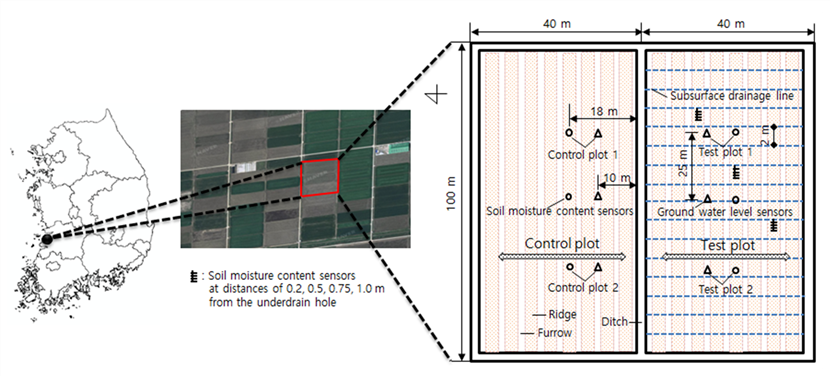
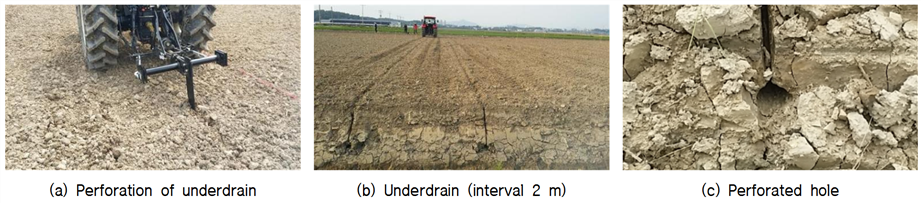
A test field was prepared in a farm in Sinheung-dong, Iksan-si, Jeollabuk-do, South Korea (N: 35° 55′51″, E: 126° 59′14″). An underdrain perforation test plot (4,000 m2, 40 m × 100 m) and a control plot (4,000 m2, 40 m × 100 m) were formed on a test field with a width of 80 m and length of 100 m, as shown in Fig. 3. For the underdrainage of the test plot, an underdrain hole was created by passing a bullet rod with a diameter of 60 mm into a 50 cm deep soil layer below the surface using a mole drainer attached to a tractor. The underdrain interval was set to 2 m with consideration to the width of the tractor-attached work machine, soybean cultivation interval, and influencing distance of the underdrainage. Conventional cultivation without underdrain perforation was applied to the control plot. The ridge width for soybean cultivation was set to 100 cm, the height was set to 20 cm, the furrow width was set to 50 cm, and the planting interval was set to 70 cm × 40 cm with two groups for sowing soybean.
4. Measurement method
With regard to rainfall data, we collected data from a simple weather station (http://weather.rda.go.kr) installed at the National Institute of Agricultural Sciences of the Rural Development Administration, which is approximately 12 km away from the test plot. The soil moisture was measured using WT1000B (Mirae Sensor, South Korea), which is a device that can measure the soil moisture in real time. This device implements frequency-domain reflectometry (FDR), whereby the difference in the soil permittivity can be evaluated using the frequency.
In the test plot, the soil moisture measurement was conducted at a point 20 cm below the topsoil, that is, 20 cm horizontally away from the perforation point in consideration of the following aspects. First, if the measurement is performed far away from the perforation point, the sensitivity of the soil moisture change due to rainfall decreases, whereas if this distance is too close, there is a risk of soil sinking at the perforation point. Also, soybeans use moisture mainly within a soil depth of 50 cm, considering that most of the roots of soybeans are distributed within a soil depth of 30 cm (Rural Development Administration, 2017).
The temporal changes in the soil moisture content in the test plot were analyzed using the soil moisture data collected over 336 hour from August 26, 2018. Additionally, the relationship between the distance from the underdrain and the soil moisture content was analyzed by comparing the soil moisture content values between the test and control plot 70 hour after a rainfall of 32 mm.
A groundwater-level observation well was installed by vertically excavating the point indicated by △ in Fig. 3 down to 30 cm below the surface and inserting a round pipe with a diameter of 150 mm to a depth of 30 cm. The total length of the groundwater-level observation well was 800mm, and an ultrasonic distance sensor (UM18, Germany) was installed at the top to measure the water level inside the well. The groundwater level was measured at 1 hour intervals to investigate the water level changes in the test and control plots for rainfalls of 157.0 mm, 80.5 mm, and 41.5 mm over approximately 350 hour from August 23, 2018. The groundwater level variations of the test and control plots over the elapsed time were also compared.
The growth and quantity of soybeans were randomly selected from 60 bean plants in the test plot and control plot, according to the Agricultural Science and Technology Research and Analysis Standard of the Rural Development Administration (2003). The length of the soybean (length from the lowest cotyledon node to the tip of the stem), the number of main stem cuts (the number of cuts from the primary leaf to the tip of the end), and the number of branches (branches with more than 2 cuts) were measured to evaluate the soybean growth, and this was conducted 55 days after the sowing. For the quantity measurement, the number of pods per stem (number of pods without fertility), the weight of 100 whole kernel grains (whole weight of 100 perfect kernels with a moisture content less than 13%), and grain weight were investigated.
Ⅲ. Results
1. Soil moisture variations in test plot
The graph in Fig. 5(a) compares the soil moisture content between the test and the control plots. The graph in part <1> compares the soil moisture content variations between the test and the control plots over 81 hour under a rainfall of 157.0 mm. As presented in Table 3, in the case of Rainfall 1, the average soil moisture content during the rainfall in the test plot changed from 70.6 to 43.8% after 81 hour, which amounts to a difference of 26.8%. However, in the control plot, the average soil moisture content during the rainfall changed from 73.7% to 67.8% after 81 hour, which amounts to a difference of 5.9%. In other words, compared with the control plot, the soil moisture content of the test plot decreased 4.5 times faster. The graph in part <2> compares the soil moisture content variation curves between the test and the control plots over 88 hour under a rainfall of 80.5 mm. In the test plot, the soil moisture content exhibited an average soil moisture content difference of 22.8%. However, in the control plot, the average soil moisture content difference was 5.9%. The graph in part <3> shows the change in the soil moisture content of the test plot over 57 hour during a rainfall of 41.5 mm. The average soil moisture content difference was 22.3% for the test plot, and 6.9% for the control plot.
Table 3
Soil moisture content variations in test and control plots
| Item | Maximum soil moisture content* (%) | Minimum soil moisture content** (%) | Variation in soil moisture content (%) | ||
| Rainfall 1 | Test plot | 1 | 66.7 | 44.0 | 22.7 |
| 2 | 74.4 | 43.5 | 30.9 | ||
| Avg. | 70.6 | 43.8 | 26.8 | ||
| Control plot | 1 | 76.7 | 69.6 | 7.1 | |
| 2 | 70.6 | 66.0 | 4.6 | ||
| Avg. | 73.7 | 67.8 | 5.9 | ||
| Rainfall 2 | Test plot | 1 | 63.6 | 44.7 | 18.9 |
| 2 | 70.9 | 44.2 | 26.7 | ||
| Avg. | 67.3 | 44.5 | 22.8 | ||
| Control plot | 1 | 72.8 | 67.4 | 5.4 | |
| 2 | 69.5 | 63.1 | 6.4 | ||
| Avg. | 71.2 | 65.3 | 5.9 | ||
| Rainfall 3 | Test plot | 1 | 62.9 | 44.9 | 18.0 |
| 2 | 72.8 | 46.3 | 26.5 | ||
| Avg. | 67.9 | 45.6 | 22.3 | ||
| Control plot | 1 | 74.4 | 67.3 | 7.1 | |
| 2 | 69.5 | 62.8 | 6.7 | ||
| Avg. | 72.0 | 65.1 | 6.9 | ||
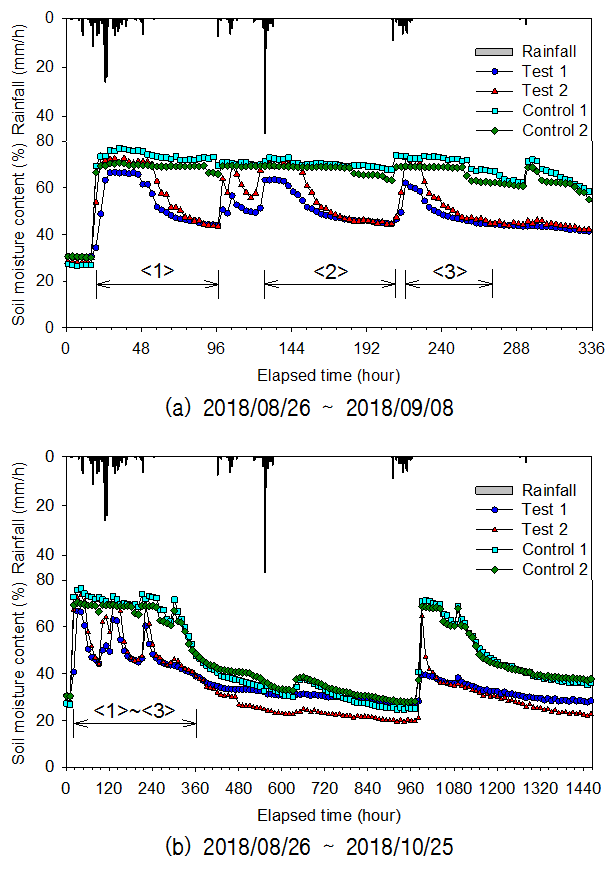
As time elapsed after the rainfall, the difference between the maximum and minimum soil moisture content ranged between 22.3% and 26.8% in the test plot and between 5.9% and 6.9% in the control plot. Thus, compared with the control plot, the soil moisture content of the test plot decreased 3.2~4.5 times faster.
Table 4 lists the average soil moisture content variation over 72 hour after the rainfall, and the average soil moisture content variations over 1,463 hour after the rainfall. Furthermore, the graph in Fig. 5(b) shows the comparison of the soil moisture content between the test and the control
Table 4
Soil moisture content after rainfall for each test plot
| Classification | Average soil moisture content over 72 hour after rainfall (%) | Average soil moisture content over 1,463 hour (%) |
| Test plot | 47.0 | 34.5 |
| Control plot | 68.6 | 46.6 |
plots over 1,463 hour. During this period, the total rainfall was 430 mm.
The average soil moisture content over 72 hour after the rainfall was 47.0% in the test plot and 68.6% in the control plot. Thus, within three days, the soil drainage in the control plot was lower than that in the test plot. Furthermore, the average soil moisture content over 1,463 hour was 34.5% in the test plot and 46.6% in the control plot. Clearly, the soil moisture content in the control plot was higher.
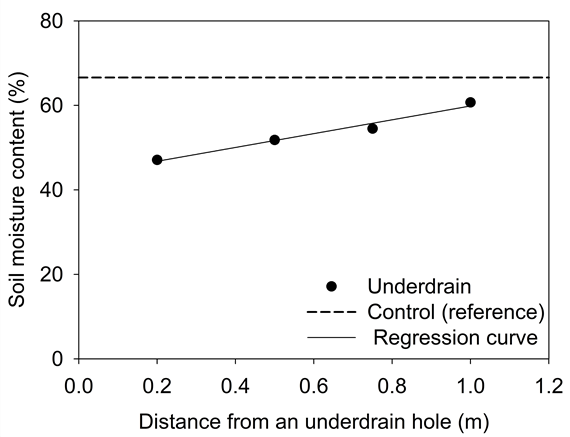
The soil moisture contents at the distances of 0.2 m, 0.5 m, 0.75 m, and 1.0 m from the underdrain hole were 47.1%, 51.8%, 54.5%, and 60.7%, respectively. The distance from the underdrain and the soil moisture content are positively correlated (Fig. 6). The degree to which the soil moisture content changes due to underdrainage varies with the textural class of the soil and the groundwater level. In this study, the effect of the underdrain was observed upon comparison with 66.6% of the control plot. This trend is consistent with the fact that the soil moisture content between two underdrains is highest at the middle position (James, 1957).
2. Variations in groundwater level by test plot
The graphs in Fig. 7, A, B, C, and D show the groundwater level of each test plot. The bar graphs <A’>, <B’>, and <C’> at the top indicate that the hourly rainfall during each period was 157.0 mm, 80.5 mm, and 41.5 mm.
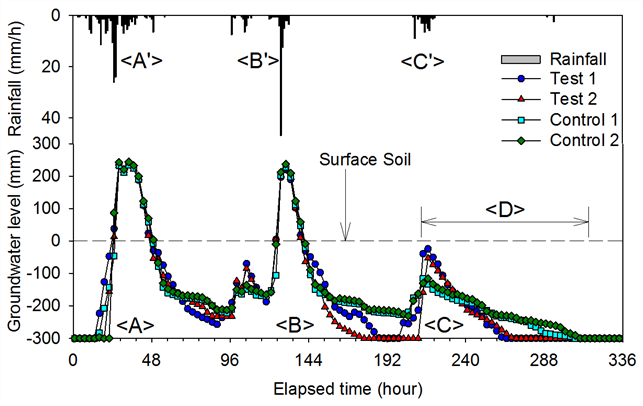
As shown in the groundwater-level graph, the groundwater level sharply increased after the rainfall and then decreased in a relatively rapid manner within 72 hour. However, the decreasing rate after the rainfall varied in the test plot. Specifically, Fig. 8 shows the graph of part <D> in Fig. 7, which indicates that the groundwater level decreased as time elapsed. In other words, this graph exhibits a decreasing trend for the groundwater level of each test plot in 1 hour intervals after the rainfall of 41.5 mm.
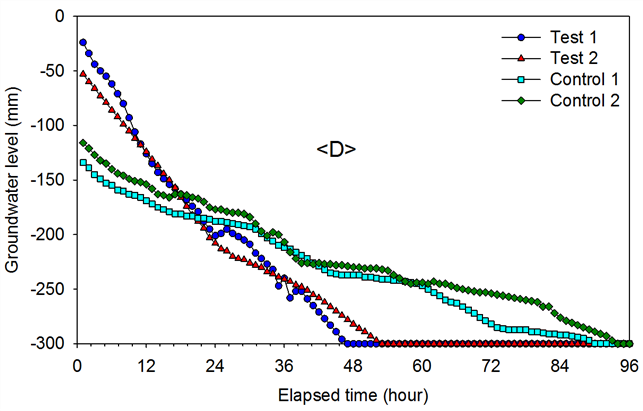
As presented in , it took 49 hour and 55 hour for the initial water level below the surface of the test plot to decrease from -6 mm and -31 mm to -300 mm, respectively. In contrast, for the control plot, it took 92 hour and 95 hour for the initial groundwater level below the surface to decrease from -111 mm and -120 mm to -300 mm, respectively. The hourly average groundwater level reduction was -5.45 mm in the test plot and -1.97 mm in the control plot. Hence, the hourly groundwater level in the test plot decreased 2.8 times faster than that in the control plot. This is consistent with the results obtained by Jeon et. al. (2017), who conducted an underdrainage test at a poorly drained paddy field and found that, depending on the shape of the mole drainer, the groundwater level in the test plot decreased 3.3 to 4.1 times faster over 72 hour, compared with the control plot, after a rainfall of 47.5 mm.
Table 5
Comparison of hourly reduction in groundwater level for test and control plots
3. Investigation of soybean growth and quantity
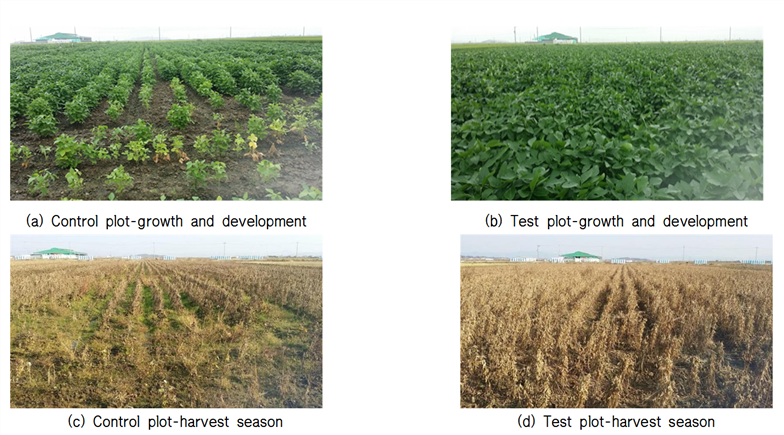
The soybean growth and quantity were investigated during the cultivation period for each test plot in a paddy field wherein soybeans are cultivated. The results revealed that the stem length, number of main stem nodes, and soybean yield were higher in the test plot compared with the control plot, as presented in Table 6.
Table 6
Comparison of soybean plant growth
| Division | Flowering date (M.D) | Average stem length (cm) | Average No. of branches per plant (ea) | Average No. of main stem nodes (ea) | Average No. of pods (ea) | Average weight of 100 seeds (g) | Yield (kg/10a) |
| Control plot | 8.14 | 39.2 | 3.7* | 11.8 | 58.2 | 22.3 | 146.0 |
| Test plot | 8.14 | 46.9* | 2.7 | 13.1* | 65.2* | 26.2* | 224.6 |
In the flowering period, the average stem length of the soybeans was 39.2 cm in the control plot and 46.9 cm in the test plot. The average number of the main stem nodes was 11.8 ea in the control plot and 13.1 ea in the test plot. These results are similar to those reported by Kim et al. (1991) and Park et al. (1995). Particularly, according to Park et al. (1995), excessive watering during the flowering period decreased the growth, and watering for 24 hour killed the growing points and significantly decreased them, compared with the control plot.
The number of pods per plant and the weight of 100 seeds were 58.2 ea and 22.3 g in the control plot, respectively; in the test plot, they were 65.2 ea and 26.2 g, respectively. The yield per 10a was 146.0 kg in the control plot and 224.6 kg in the test plot.
Figures 9 show the growth of the soybean plants and images captured at the time of soybean harvest in the control and test plots.
Ⅳ. Conclusion
The area of paddy fields wherein upland crops are cultivated is gradually increasing. In this context, we developed and applied a chain type mole drainer to a paddy field wherein soybeans are cultivated to prevent the wet injury of crops. The chain type mole drainer performed best to generate a traction of 538.4 kgf, which was considered the smallest traction among the six mole drainers (circle, round, chain, double, inverted-triangle, and square type).
The test results revealed large variations in the soil moisture content and groundwater level after a rainfall compared with the control plot, owing to the drainage in the test plot wherein mole drainage was applied using the proposed chain type mole drainer. Additionally, the soybean growth and yield were satisfactory.
The underdrain perforation distance was set to 2 m, and a mole drain for permeability holes with a diameter of 60 mm was prepared at a depth of 50 cm below the surface. From 57 hour to 88 hour after a rainfall of 41.5~157.0 mm, the soil moisture content decreased by 22.3~26.8% in the test plot, and by 5.9~6.9% in the control plot. Furthermore, the hourly groundwater level decreased approximately 2.8 times faster in the test plot compared with the control plot.
During the soybean cultivation period, the soil moisture and groundwater level steadily decreased after the rainfall, which suggests that the duration of underdrain produced satisfactory results over the soybean cultivation period.
However, the duration of the underdrain may vary with climatological factors, such as rainfall, rainfall intensity, rainfall frequency, and farming activities in the field such as the movement of agricultural machinery. Thus, quantitative evaluation through long-term monitoring is required.
The soybean growth and yield investigation results revealed that the soil in the control plot maintains excessive moisture content for a long time, owing to rainfall immediately after sowing, and can undergo inundation owing to heavy rainfall within a short period, which results in poor growth.
Therefore, for soybean cultivation in paddy fields, the use of the developed chain type mole drainer is expected to help in improving the drainage and increasing the soybean yield.